
Normal Distribution of Chest Measurements: Frequency Table, Histogram, and Norma
Loading the math board and drawing, please wait…
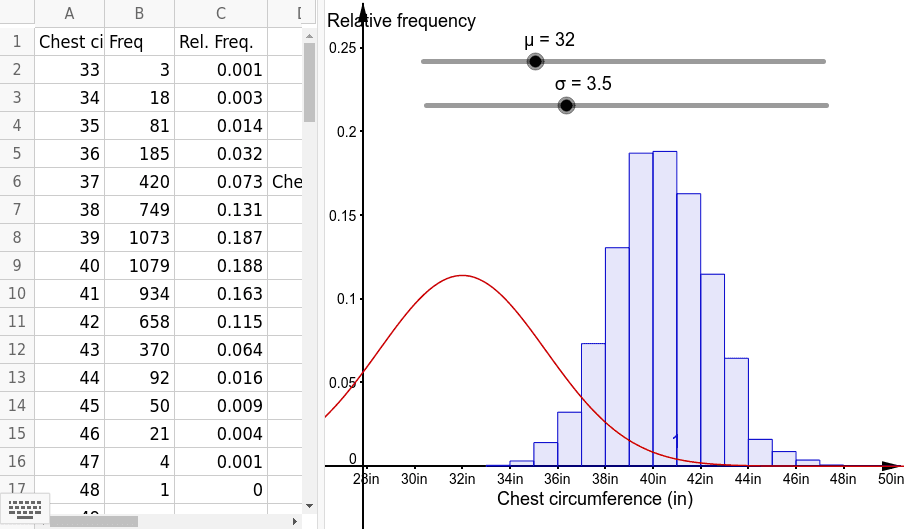
① This example illustrates the normal distribution using chest measurement data, presenting a frequency table, a histogram, and a fitted normal curve. ② Core mathematical concepts include the normal (Gaussian) distribution, frequency distribution, histograms, probability density functions, and statistical visualization. ③ Construction details: the GeoGebra commands Sum, Histogram, and Normal are employed; a large set of data objects (A1 to C3) store raw measurements, frequencies, and computed statistics. ④ Ideal for high school or introductory college statistics courses, this example helps learners grasp how real data can be modeled by a normal curve, and how to interpret frequency tables and histograms in the context of probability and statistics.
GeoGebra Commands & Parameters
Sum(B2:B17) → B20Histogram(list1, list3) → aNormal(μ, σ, x) → f