
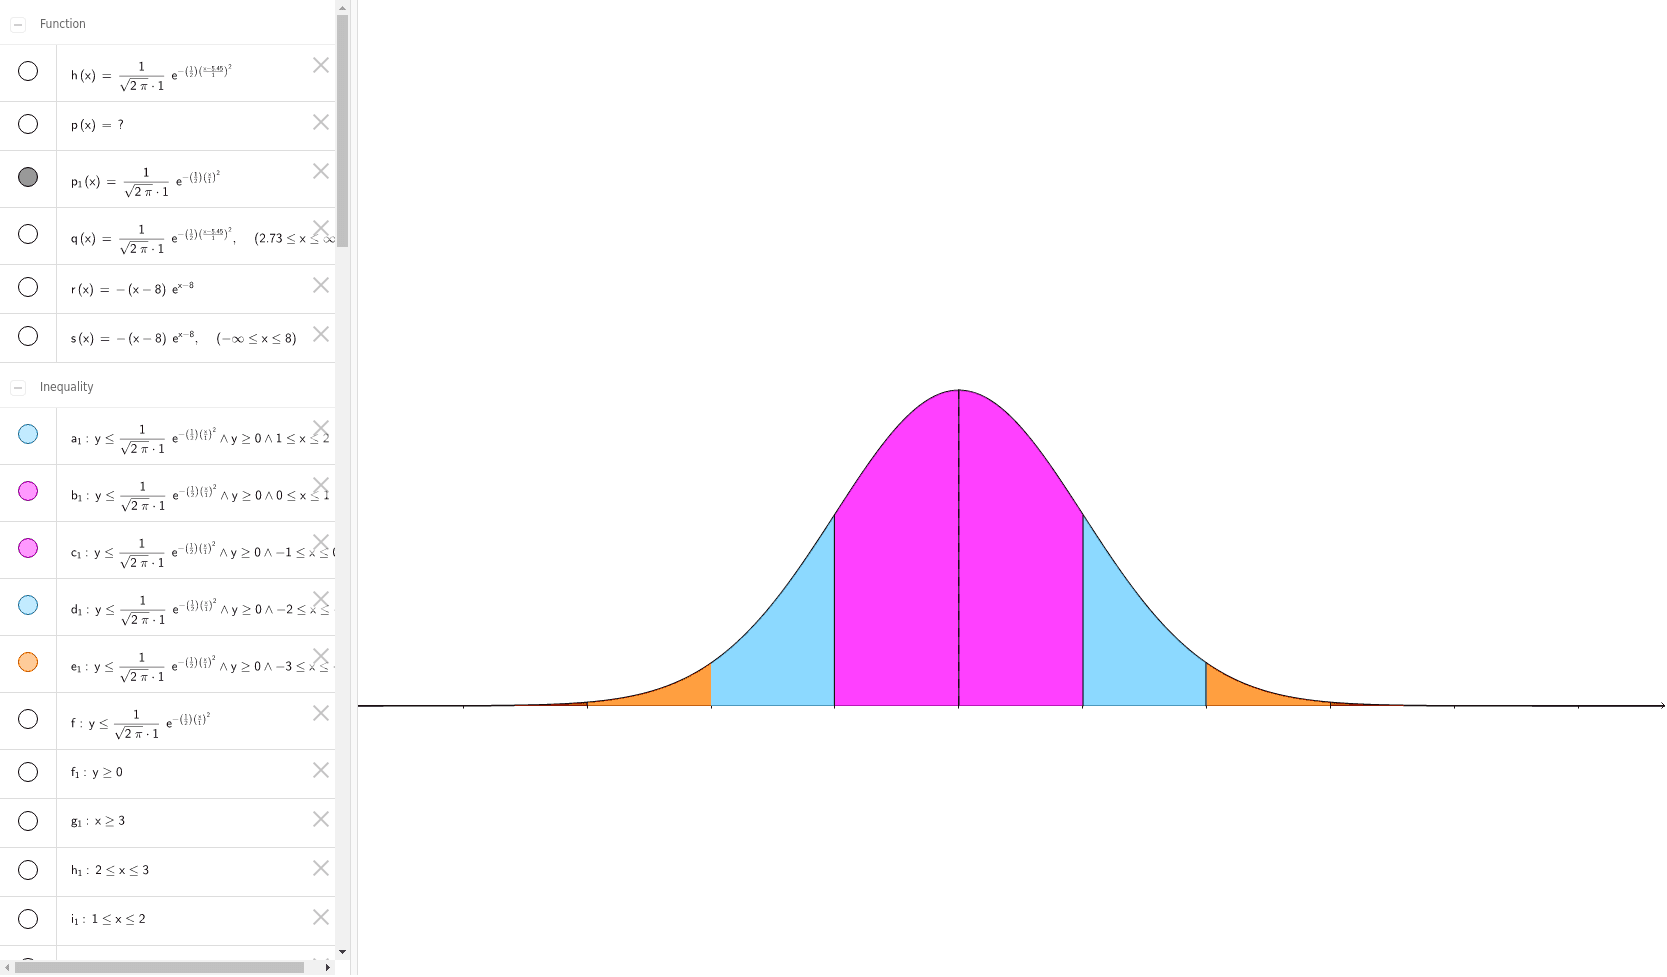
Normal Distribution Graph
Loading the math board and drawing, please wait…
This example demonstrates the graph of a normal distribution and its characteristics. Key math concepts include normal distribution, coordinate system, random variables, and statistical properties. Construction highlights involve GeoGebra commands like Point, Segment, Max, and objects such as r, N, σ, μ, f, A, B, g, σ_2, μ_2, h, C, p, q, D, E, F, G, i, j, H, I, k, s, K, L, J, M, l, m, O, P, Q, R, S, T, U, V, W, Z. Suitable for high school students and math enthusiasts studying probability and statistics.
GeoGebra Commands & Parameters
Point(r) → NPoint(xAxis) → ASegment(B, A) → gMax(h, 0, 10) → ESegment(D, F) → iSegment(E, G) → jMax(r, 0, 10) → HSegment(H, I) → kPoint(s) → KPoint(s) → LSegment(K, J) → lSegment(L, M) → mSegment(O, V) → nSegment(P, W) → tSegment(Q, Z) → aSegment(R, A_1) → bSegment(S, B_1) → cSegment(T, C_1) → dSegment(U, D_1) → e