
Normal Distribution Exploration
Loading the math board and drawing, please wait…
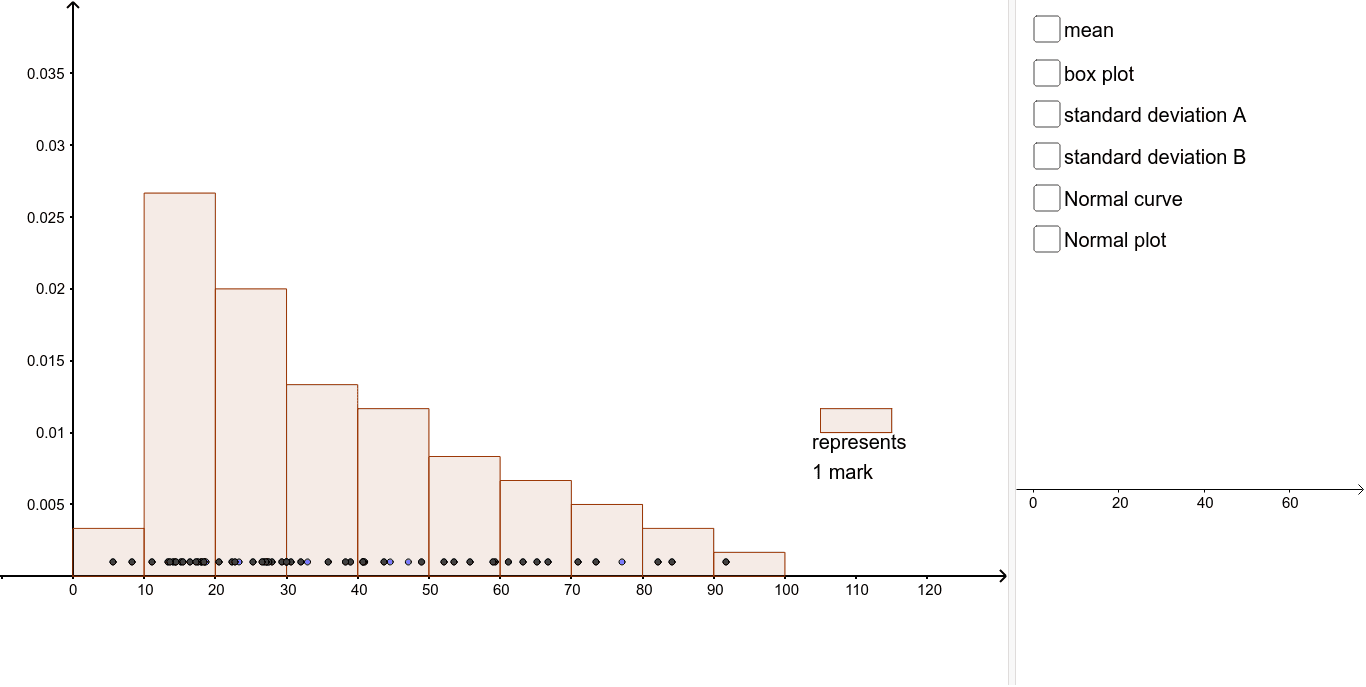
This example demonstrates the characteristics of the normal distribution. It involves core concepts of probability and statistics, using GeoGebra commands such as Segment, Point, Histogram, Mean, SD, BoxPlot, Normal, Polygon, and NormalQuantilePlot to construct an intuitive normal distribution graph. Suitable for high school and above students or teachers to understand the shape, mean, standard deviation, and other aspects of the normal distribution.
GeoGebra Commands & Parameters
Segment((0, 0.001), (100, 0.001)) → aPoint(a) → APoint(a) → BPoint(a) → CPoint(a) → DPoint(a) → EPoint(a) → FPoint(a) → GPoint(a) → HPoint(a) → IPoint(a) → JPoint(a) → KPoint(a) → LPoint(a) → MPoint(a) → NPoint(a) → OPoint(a) → PPoint(a) → QPoint(a) → RPoint(a) → SPoint(a) → TPoint(a) → UPoint(a) → VPoint(a) → WPoint(a) → ZPoint(a) → A_1Point(a) → B_1Point(a) → C_1Point(a) → D_1Point(a) → E_1Point(a) → F_1Point(a) → G_1Point(a) → H_1Point(a) → I_1Point(a) → J_1Point(a) → K_1Point(a) → L_1Point(a) → M_1Point(a) → N_1Point(a) → O_1Point(a) → P_1Point(a) → Q_1Point(a) → R_1Point(a) → S_1Point(a) → T_1Point(a) → U_1Point(a) → V_1Point(a) → W_1Point(a) → Z_1Point(a) → A_2Point(a) → B_2Point(a) → C_2Point(a) → D_2Point(a) → E_2Point(a) → F_2Point(a) → G_2Point(a) → H_2Point(a) → I_2Point(a) → J_2Point(a) → K_2Point(a) → L_2Histogram({0, 10, 20, 30, 40, 50, 60, 70, 80, 90, 100}, B1:B60, true, 0.016666666666666666) → cMean(B1:B60) → meanSD(B1:B60) → sdBoxPlot(0.03, 0.001, mean - sd, mean, mean, mean, mean + sd) → dNormal(mean, sd, x) → gSegment((mean, 0), (mean, 0.02)) → hBoxPlot(0.033, 0.001, mean - (2 * sd), mean, mean, mean, mean + (2 * sd)) → eBoxPlot(0.036, 0.001, mean - (3 * sd), mean, mean, mean, mean + (3 * sd)) → fBoxPlot(0.025, 0.001, B1:B60) → bPolygon((105, 0.01), (115, 0.01), (115, 0.0116667), (105, 0.0116667)) → poly2, s, t, a_1, b_1NormalQuantilePlot(B1:B60) → list1
AI Drawing Prompt Reference
Draw a horizontal line and place 50 evenly spaced points along it. Connect these points to form a polygon, illustrating the basic shape of a normal distribution, suitable for teaching probability and statistics.
The prompt above was compiled from the original drawing commands and is for reference only.