
Normal Distribution Dynamic Demo & Probability Calculation
Loading the math board and drawing, please wait…
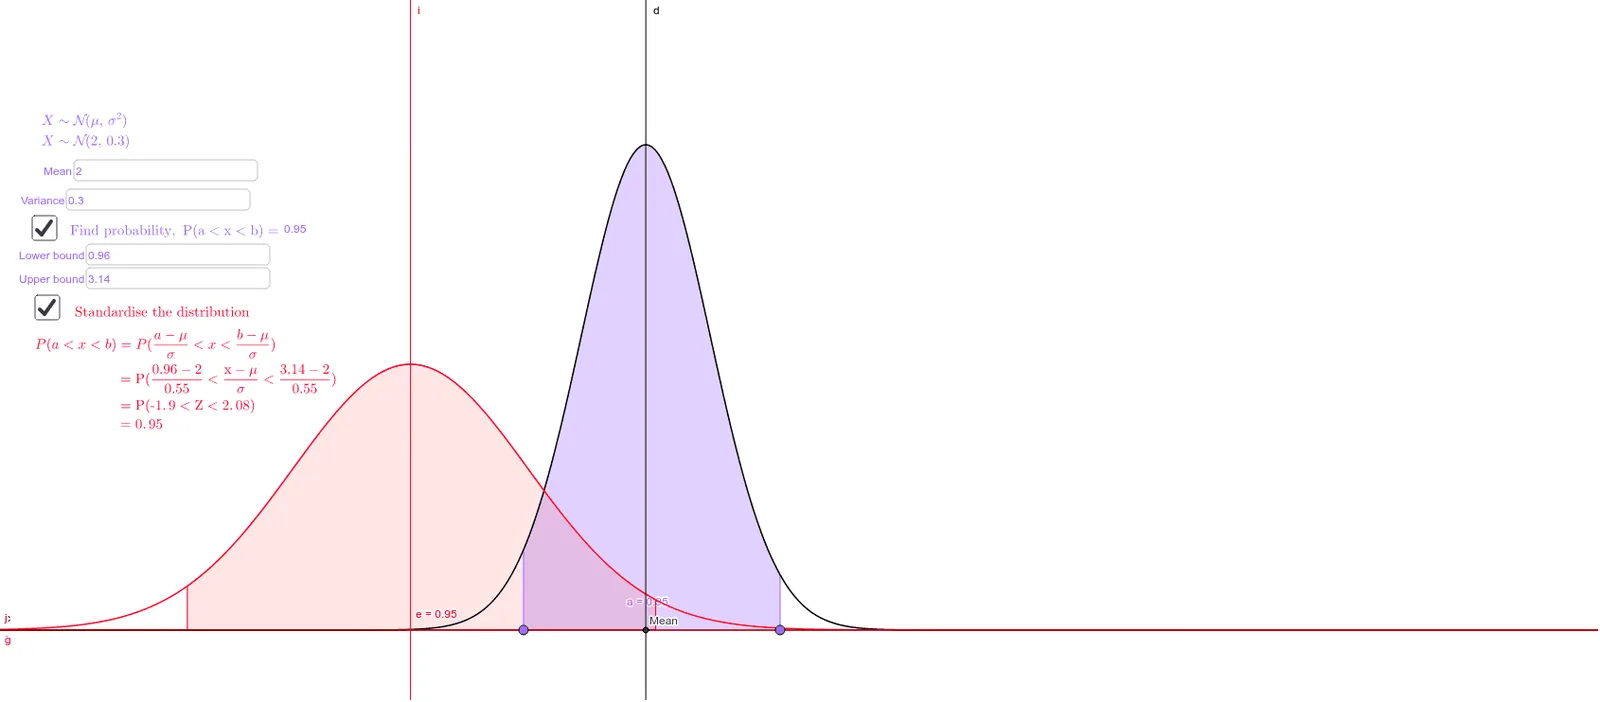
This GeoGebra example dynamically visualizes the normal distribution's probability density function, allowing users to adjust the mean and standard deviation via interactive sliders. It demonstrates how the curve shifts and spreads, and uses definite integrals to calculate probabilities over user-defined intervals. Core mathematical concepts include the normal distribution, probability density function, cumulative distribution, mean, variance, and the geometric interpretation of definite integrals in probability. The construction leverages GeoGebra commands such as Normal (to generate the PDF), Integral (to compute areas/probabilities), Intersect (to find key points), along with Textfield, Lowerbound, Upperbound, Mean, SD, and various input objects for real-time parameter control. It is suitable for high school statistics, pre-calculus, or university-level introductory probability and statistics courses, providing an intuitive platform for exploring parameter effects and integral-based probability calculations.
GeoGebra Commands & Parameters
Normal(Mean_1, Variance^(0.5), x) → fTextfield(Mean_1) → inputBox1Textfield(Variance) → inputBox2Textfield(Lowerbound) → inputBox3Textfield(Upperbound) → inputBox4Integral(f, Lowerbound, Upperbound) → aIntersect(d, c) → MeanNormal(0, 1, x) → gIntegral(g, StandardLowerbound, Standardupperbound) → e
AI Drawing Prompt Reference
Draw a dynamic normal distribution curve where users can adjust the mean and standard deviation using sliders. Show the area under the curve to calculate probabilities. Provide input fields for users to define upper and lower bounds, and display the calculated probability values. Also, draw a standard normal distribution curve and show the area under it.
The prompt above was compiled from the original drawing commands and is for reference only.