
Binomial Distribution & Hypothesis Testing
Loading the math board and drawing, please wait…
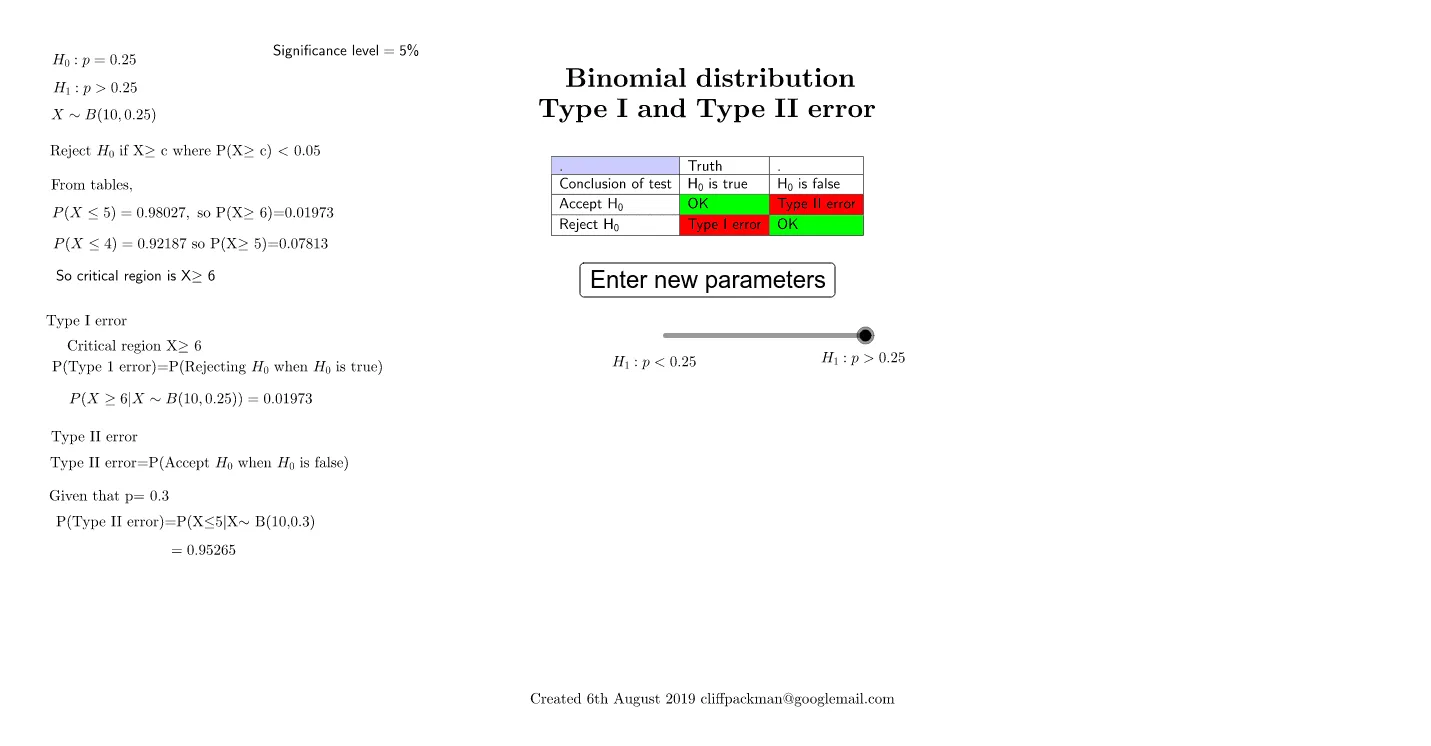
This example demonstrates the graphical representation of Type I and Type II errors in the context of binomial distribution. Core math concepts include binomial distribution, hypothesis testing, and probability calculation. It is constructed using GeoGebra commands and objects like TableText, Sequence, Append, CountIf, BinomialDist. Suitable for high school and above students to learn key concepts in probability & statistics.
GeoGebra Commands & Parameters
TableText({{B1, C1, D1}, {B2, C2, D2}, {B3, C3, D3}, {B4, C4, D4}}, "|_") → text2Sequence(10000) → list2Append(0, list2) → list1CountIf(BinomialDist[Number, p, a, true] < 1 - significancedecimal, a, list1) → type1greaterBinomialDist(Number, p, type1greater, true) → aBinomialDist(Number, p, type1greateradditional, true) → bBinomialDist(Number, pnew, type1greater, true) → eBinomialDist(Number, p, type1less, true) → gBinomialDist(Number, p, type1lessnext, true) → h