
Normal Distribution & Error Types Demo
Loading the math board and drawing, please wait…
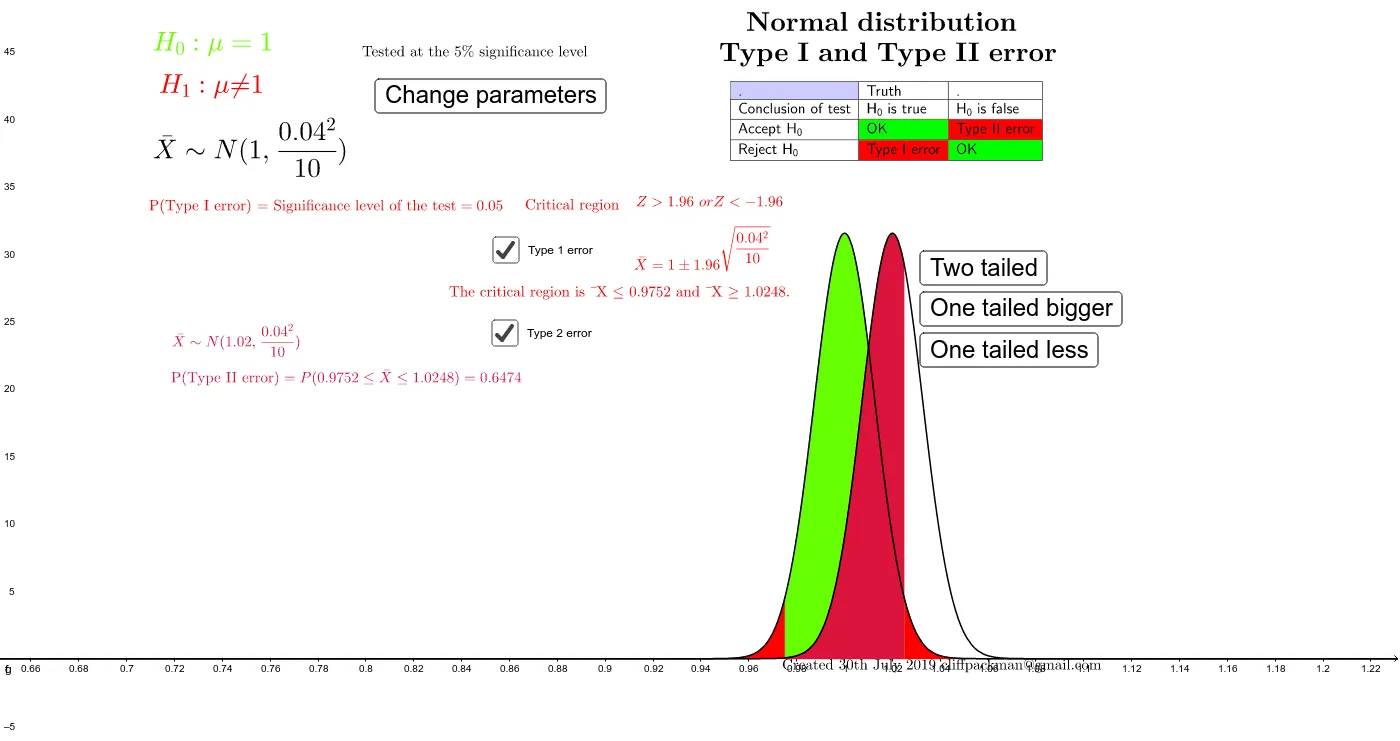
This example demonstrates the graphical interpretation of Type I and Type II errors in hypothesis testing under a normal distribution. It involves core math concepts like normal distribution, significance level, error types, and integral calculations. Constructed using commands like TableText, InverseNormal, Normal, Integral from GeoGebra. Suitable for high school students and teachers needing a deeper understanding of statistical inference.
GeoGebra Commands & Parameters
TableText({{B1, C1, D1}, {B2, C2, D2}, {B3, C3, D3}, {B4, C4, D4}}, "|_") → text2InverseNormal(0, 1, 1 - tailedtailed) → zvalueNormal(assumednewmean, (stdeviation^(2) / samplesize)^(0.5), Lowerbound) → a_1Normal(assumednewmean, (stdeviation^(2) / samplesize)^(0.5), upperbound) → a_3Normal(mean, (stdeviation^(2) / samplesize)^(0.5), x) → fIntegral(f, -1.0E99, Lowerbound) → aIntegral(f, upperbound, 1.0E99) → bIntegral(f, Lowerbound, upperbound) → cNormal(assumednewmean, (stdeviation^(2) / samplesize)^(0.5), x) → gIntegral(g, Lowerbound, upperbound) → eInverseNormal(0, 1, 1 - significancelevel) → zvalue1Integral(f, Greaterupperbound, 1.0E99) → iIntegral(f, -1.0E99, Greaterupperbound) → jIntegral(g, -1.0E99, Greaterupperbound) → kNormal(assumednewmean, (stdeviation^(2) / samplesize)^(0.5), Greaterupperbound) → a_5Integral(f, -1.0E99, Lessthanlowerbound) → lIntegral(f, Lessthanlowerbound, 1.0E99) → mIntegral(g, Lessthanlowerbound, 1.0E99) → n