
Normal Distribution Curve by sonom
Loading the math board and drawing, please wait…
In collections
Probability & Statistics
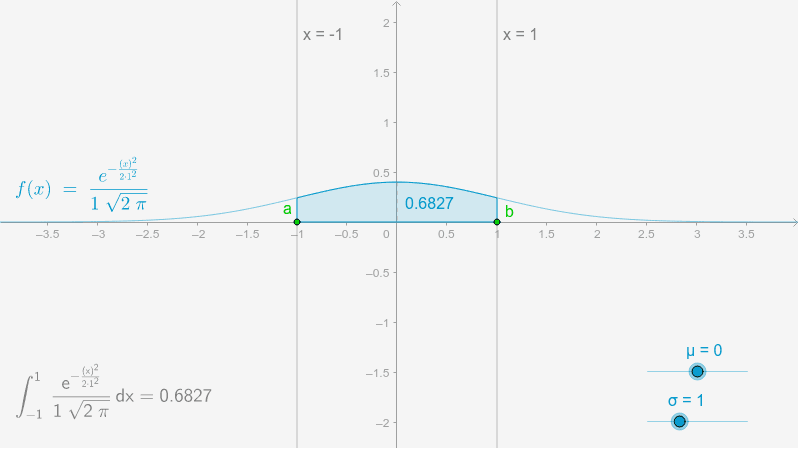
This example demonstrates the normal distribution curve, involving core mathematical concepts such as probability and statistics. Using GeoGebra commands like Intersect, Point, and Segment, the normal distribution curve is constructed. Suitable for high school and above students to learn probability and calculus.
GeoGebra Commands & Parameters
Intersect(f, xAxis, (-24.533000000000012, 8.070772818000244E-132)) → AIntersect(f, xAxis, (-24.54300000000001, 6.314630496205554E-132)) → BPoint(xAxis) → CSegment(C, D) → a_1Point(a_1) → EOrthogonalLine(C, xAxis) → aOrthogonalLine(E, xAxis) → bIntegral(f, x(C), x(E)) → cIntersect(f, d, (0, 0.3989422804014327)) → FIntersect(d, xAxis) → GSegment(F, G) → e
AI Drawing Prompt Reference
Draw a normal distribution curve with intersection points A and B with the x-axis, and the area under the curve c. Draw a line segment a through points C and D, and a perpendicular line segment b through point E. Then, calculate the integral of the curve between points C and E, which is c. Find the intersection points F and G of the curve with y=0.3989422804014327 and the x-axis, and draw a line segment e connecting F and G.
The prompt above was compiled from the original drawing commands and is for reference only.