
Normal Distribution by Mark Willis (2)
Loading the math board and drawing, please wait…
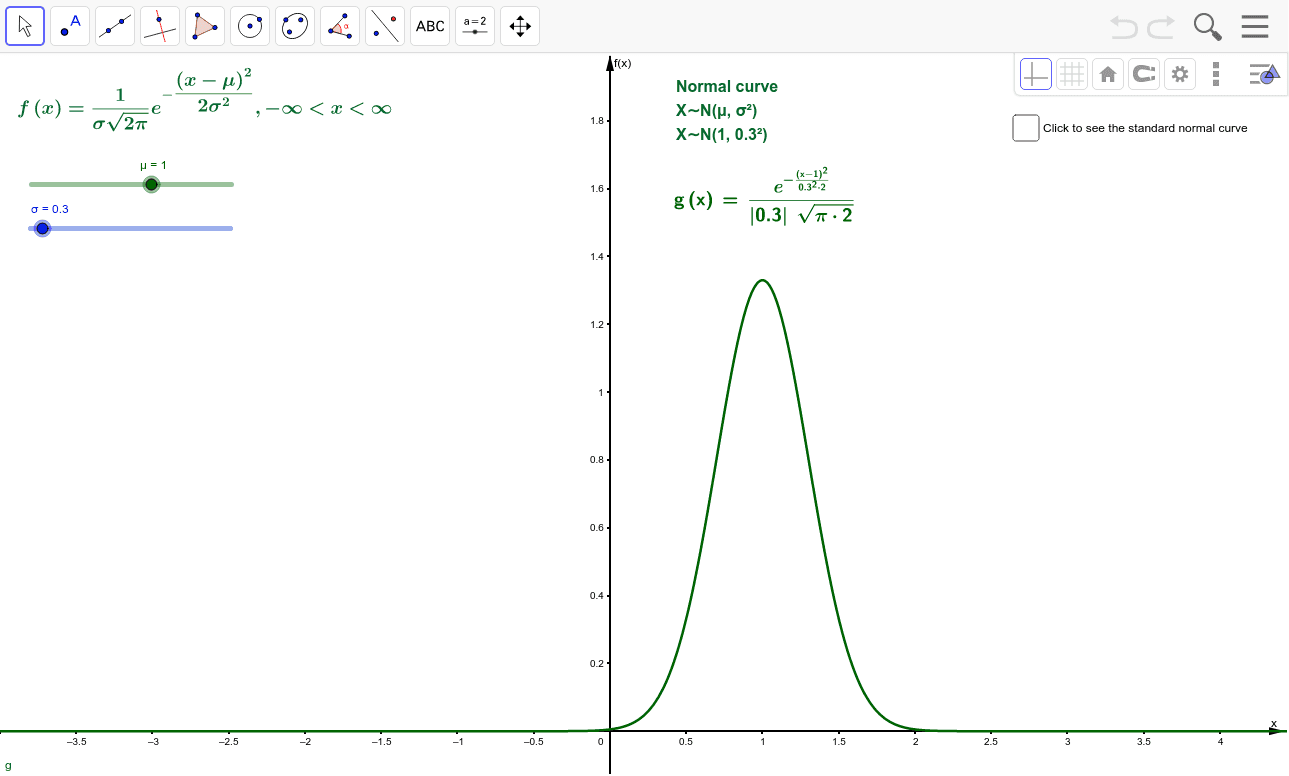
This example demonstrates the normal distribution curve and how its parameters μ (mean) and σ (standard deviation) affect its shape. Key math concepts include normal distribution, function graphing, parameter manipulation, and histogram visualization. GeoGebra commands used are Normal for plotting f, sliders for μ and σ, and text objects text1 to text6. Suitable for high school and above students learning probability & statistics.
GeoGebra Commands & Parameters
Normal(0, 1, x) → fNormal(μ, σ, x) → gLaTeX(g, true, true) → text1LaTeX(f, true, true) → text2