
Normal Curve with SD Slider
Loading the math board and drawing, please wait…
In collections
Statistical Applets
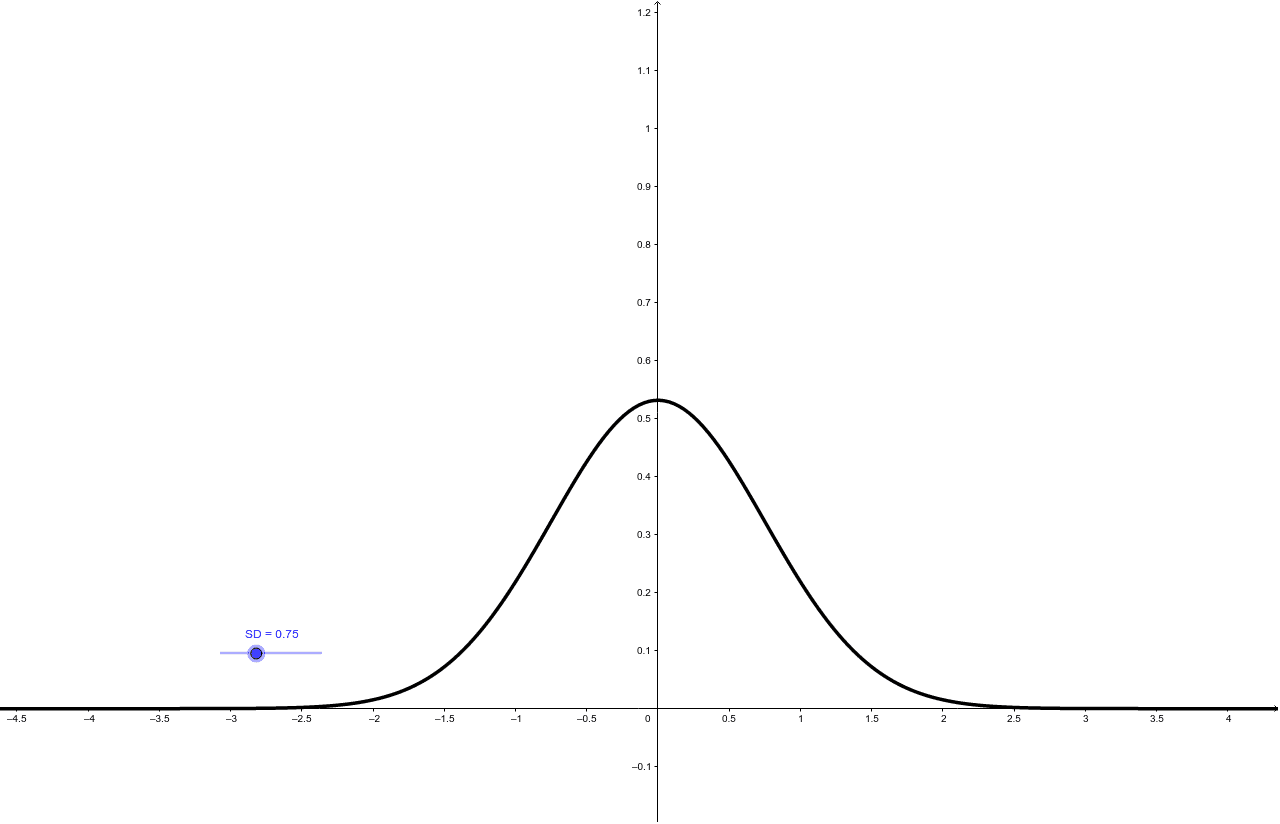
This interactive GeoGebra applet demonstrates how the shape of a normal distribution curve changes as the standard deviation (SD) is adjusted via a slider. It visualizes the probability density function of a normal distribution, highlighting the relationship between SD and curve spread, peak height, and inflection points. The construction uses a slider object named SD to control the standard deviation parameter, and a function f defined as the normal density formula, allowing real-time updates of the curve. This resource is ideal for high school or introductory college statistics courses, helping students grasp the impact of variability on distribution shape, and can also support lessons in calculus involving curve sketching and area under the curve.
GeoGebra Commands & Parameters
Numeric SD(0.75)f(x) = 1 / (SD * sqrt(2 * π)) * ℯ^(-0.5 * (x / SD)^(2))
AI Drawing Prompt Reference
Draw a normal distribution curve that changes its width and height by adjusting a standard deviation slider. First, create a standard deviation slider with an initial value of 0.75, then define the normal distribution function as 1 / (SD * sqrt(2 * π)) * ℯ^(-0.5 * (x / SD)^(2)) using the slider value.
The prompt above was compiled from the original drawing commands and is for reference only.