
Normal Curve Demonstration
Loading the math board and drawing, please wait…
In collections
Statistics Demonstrations
Statistics Demonstrations
Statistics Demonstrations
Statistics Demonstrations
Statistics Demonstrations
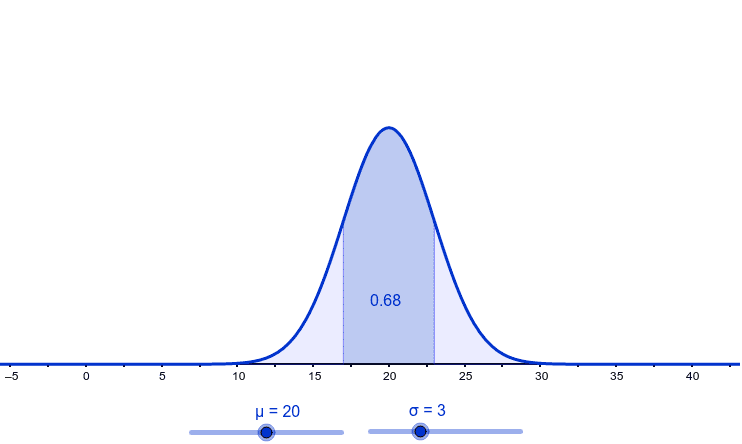
This example demonstrates how changing the parameters of a normal distribution affects the center and spread of a normal curve. It involves key concepts such as mean and standard deviation. Using GeoGebra commands like Normal, Segment, and Integral, users can dynamically observe the impact of parameter changes on the curve. Suitable for high school mathematics education and students learning probability and statistics.
GeoGebra Commands & Parameters
Normal(μ, σ, x) → gSegment((μ, 0), (μ, g(μ))) → cSegment((μ + σ, 0), (μ + σ, g(μ + σ))) → bSegment((μ - σ, 0), (μ - σ, g(μ - σ))) → aIntegral(g, μ - σ, μ + σ) → dIntegral(g, μ - (4 * σ), μ - σ) → eIntegral(g, μ + σ, μ + (4 * σ)) → f