
Nature of Critical Points of Function f(x, y): Local Max/Min/Saddle
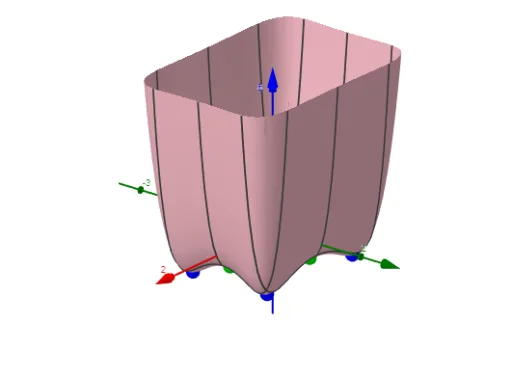
Loading the math board and drawing, please wait…
This example demonstrates how to visualize and analyze the critical points of a multivariable function f(x, y) using GeoGebra, including local maxima, minima, and saddle points. Key mathematical concepts involved are multivariable functions, partial derivatives, second partial derivatives, Hessian matrix discriminant, and local extremum/saddle point determination. Construction highlights include using commands like Simplify for expression simplification, ImplicitCurve for implicit curve plotting, Zip and Sequence for generating data sequences, TableText for displaying text, LaTeX for mathematical formula rendering, Sort and Length for sorting and length calculation, Max for finding maximum values, and RotateText for text rotation. Objects used include f, fx, fy, fxx, fxy, fyy, fyx, etc. Suitable for high school students and teachers for learning and teaching the methods of determining extrema of multivariable functions.
GeoGebra Commands & Parameters
Simplify(Derivative[f, x, 1]) → fxSimplify(Derivative[f, y, 1]) → fyImplicitCurve(fx(x, y)) → axImplicitCurve(fy(x, y)) → aySimplify(Derivative[fx, x, 1]) → fxxSimplify(Derivative[fx, y, 1]) → fxySimplify(Derivative[fy, y, 1]) → fyySimplify(Derivative[fy, x, 1]) → fyxZip({{fxx(a), fxy(a)}, {fyx(a), fyy(a)}}, a, l1) → MZip(Determinant[a], a, M) → DZip(fxx(a), a, l1) → f_{xx}Sequence(If[D(i) > 0, If[f_{xx}(i) > 0, "local minimum", "local maximum"], If[(D(i) * f_{xx}(i)) ≟ 0, "?", "saddle point"]], i, 1, Length[l1]) → l4Zip((x(a), y(a), f(a)), a, l1) → l5Zip(fx(a), a, l1) → lfxZip(fy(a), a, l1) → lfyTableText(Append["i", 1…Length[l1]], Append["critical points", l5], Append["f_{x}", lfx], Append["f_{y}", lfy], Append["f_{xx}", f_{xx}], Append["Det", D], Append["", l4], "v") → text1LaTeX(f, true) → text2Sequence(If[D(i) > 0, If[f_{xx}(i) > 0, 1, 2], If[D(i) ≟ 0, -5, -1]], i, 1, Length[l1]) → l4aSort(l5, l4a) → l5aSort(l1, l4a) → l1aLength(lmax) → lämaxLength(lmin) → läminLength(lsad) → läsadSort(l4, l4a) → l4aaTableText(Append["i", 1…Length[l1]], Append["critical points", l5a], Append["", l4aa], "v") → text1aLength(lq) → läqImplicitCurve(f(x, y) - z0) → IFxyZip((x(a), y(a)), a, lsad) → lsad_2Zip((x(a), y(a)), a, lq) → lq_2Zip((x(a), y(a)), a, lmax) → lmax_2Zip((x(a), y(a)), a, lmin) → lmin_2Max(z(lmax)) → maxMax(z(lmin)) → minRotateText(txt1, 90°) → txt2