
Mystery Functions Part 7
Loading the math board and drawing, please wait…
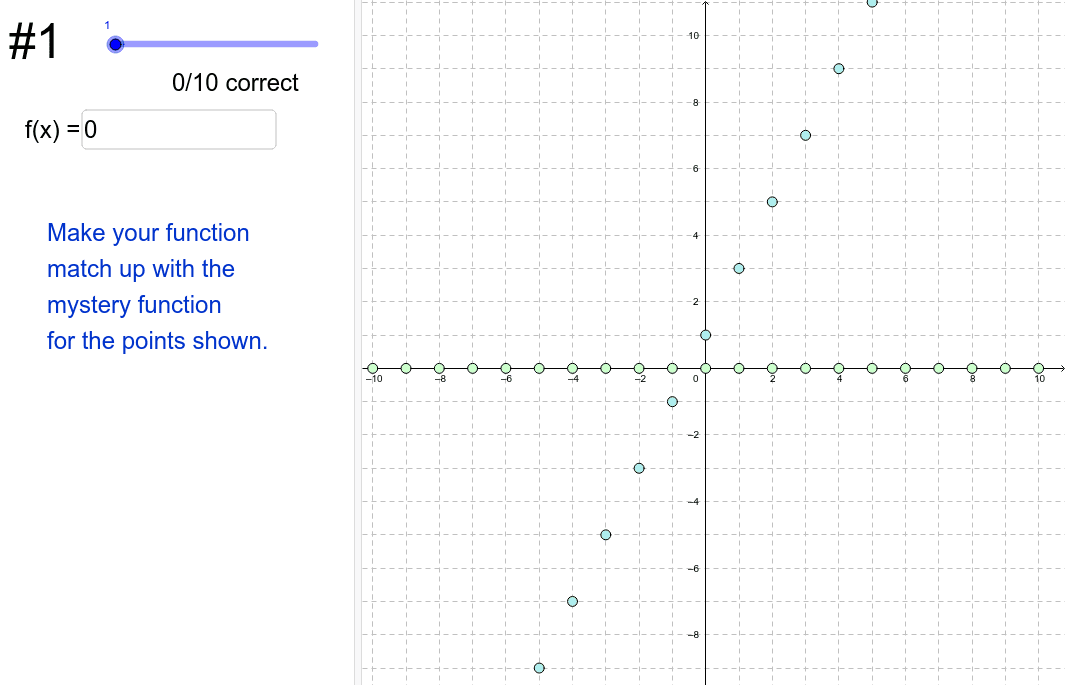
This example engages users in guessing function expressions based on provided graphs. It involves core math concepts like function graphs, linear regression, parallelograms, and geometric mean. Constructed using GeoGebra commands like Textfield, Length, Corner, Segment, Midpoint, Polygon, Sequence, Sum, and objects such as f, A1, B1, C1, etc. Ideal for high school mathematics education, focusing on function graph recognition and comprehension.
GeoGebra Commands & Parameters
Textfield(f) → functionInputBoxLength(problems) → numProblemsCorner(1) → cornerBLCorner(2) → cornerBRCorner(3) → cornerURCorner(4) → cornerULSegment(cornerUL, cornerBL) → sideLSegment(cornerUL, cornerUR) → sideUSegment(cornerUR, cornerBR) → sideRSegment(cornerBL, cornerBR) → sideBMidpoint(sideL) → midpointLMidpoint(sideU) → midpointUMidpoint(sideR) → midpointRMidpoint(sideB) → midpointBPolygon(midpointU, cornerUR, midpointR) → poly1, midpointr, midpointu, cornerurSequence(f(i) - m(i), i, -10, 10) → differencesSum(isCorrect) → numCorrectSequence((i, f(i)), i, -10, 10) → fPointsSequence((i, m(i)), i, -10, 10) → mPoints
AI Drawing Prompt Reference
Draw a function graph and display a parallelogram formed by four corner points with diagonals and midpoints. Create a polygon above the parallelogram and show the difference points between the function graph and the linear regression line. Use a slider to control the function expression and indicate the number of correct guesses.
The prompt above was compiled from the original drawing commands and is for reference only.