
Graphing Lines from Equations
Loading the math board and drawing, please wait…
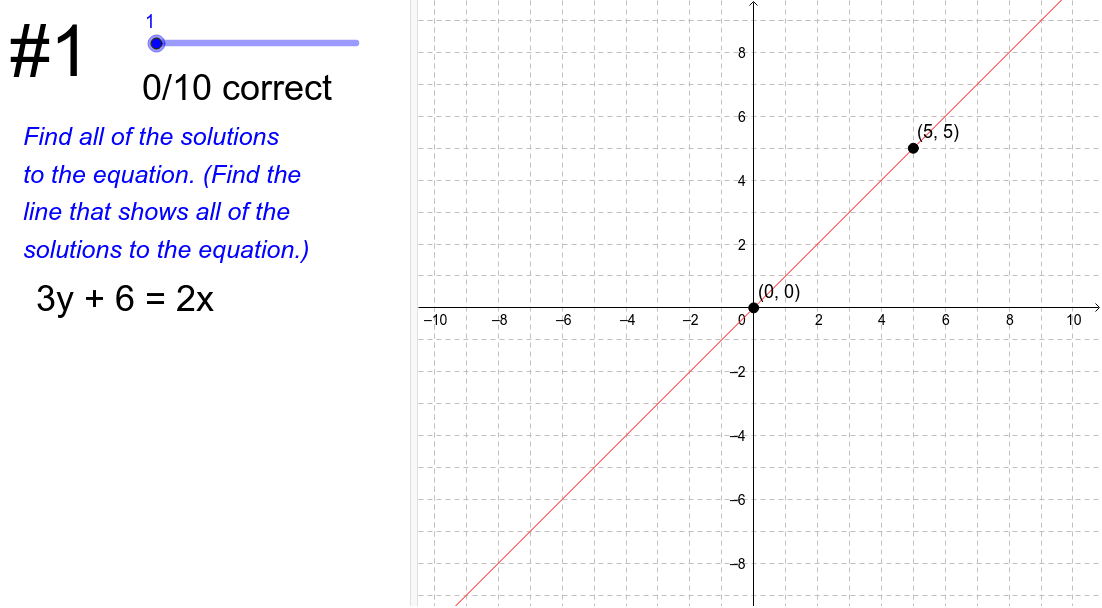
This example demonstrates how to graph lines by inputting linear equations. The core math concepts involved are analytical geometry, particularly the standard form of linear equations. Key GeoGebra commands used include Sum, Length, Text, and Line, with objects such as currentProblem, isCorrect, currentProblemDisplay, numCorrect, equations, A, B, instructionsDisplay, numProblems, numCorrectDisplay, equationsText, currentEquationDisplay, and solutionLine. It is suitable for middle school and above students learning how to represent linear equations graphically, either for teaching demonstrations or practice purposes.
GeoGebra Commands & Parameters
Sum(isCorrect) → numCorrectLength(equations) → numProblemsText(Element[equationsText, currentProblem]) → currentEquationDisplayLine(A, B) → solutionLine
AI Drawing Prompt Reference
Draw two lines based on input linear equations to show their graphical representation in the coordinate system, label the current equation with text, and connect two key points with a line to display the solution.
The prompt above was compiled from the original drawing commands and is for reference only.