
Multiply by a: Transformations of Exponential Functions
Loading the math board and drawing, please wait…
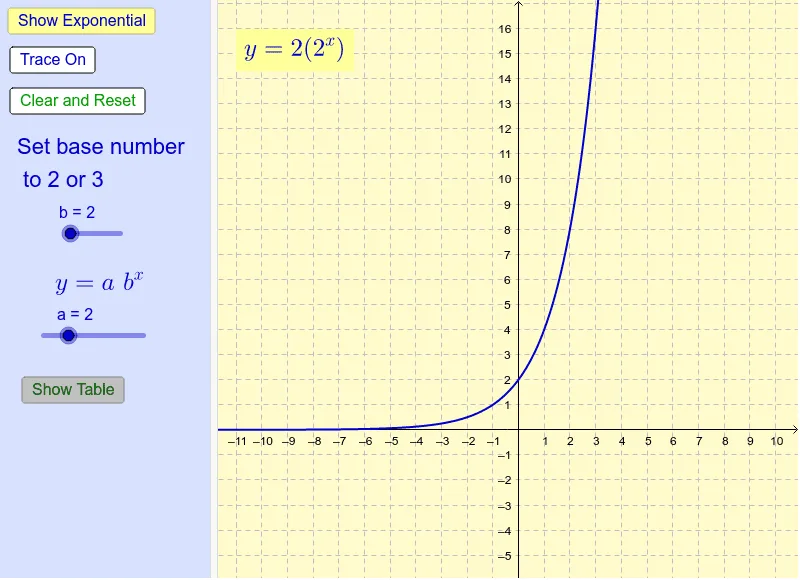
This GeoGebra example dynamically explores how changing the coefficient a in front of an exponential function y = a·b^x (with base b = 2 or 3) affects its graph. It demonstrates vertical stretching or compression, as well as reflection when a is negative, providing an interactive visual for understanding function transformations. Core mathematical concepts include exponential functions, parameters, and transformations. The construction uses sliders to control the coefficient a, a TableText command to generate a data table, and buttons/checkboxes for interactive toggling of visibility. Objects include points (A2, B2, etc.), text labels, and a table, all integrated into a user-friendly exploration environment. This resource is ideal for middle or high school students learning exponential functions, and for teachers demonstrating transformations in a classroom setting.
GeoGebra Commands & Parameters
TableText({{A1, B1, C1}, {A2, B2, C2}, {A3, B3, C3}, {A4, B4, C4}, {A5, B5, C5}, {A6, B6, C6}, {A7, B7, C7}, {A8, B8, C8}}, "c_|") → text3
AI Drawing Prompt Reference
Create an interactive graph of exponential functions of the form y = a times b to the power x, where the base b can be chosen as 2 or 3. Use a slider to adjust the coefficient a, and show how the graph stretches vertically, compresses, or reflects across the x-axis when a is negative. Display multiple curves for different a values, each labeled with its equation. Include a data table listing y-values for various x inputs across the curves. Add checkboxes or buttons to toggle the visibility of individual curves for step-by-step exploration. Keep the layout clean and suitable for classroom teaching.
The prompt above was compiled from the original drawing commands and is for reference only.