
Ms. Scanlon's Study Time Survey
Loading the math board and drawing, please wait…
In collections
UCSS Secondary Math I Unit 4 Lesson 2
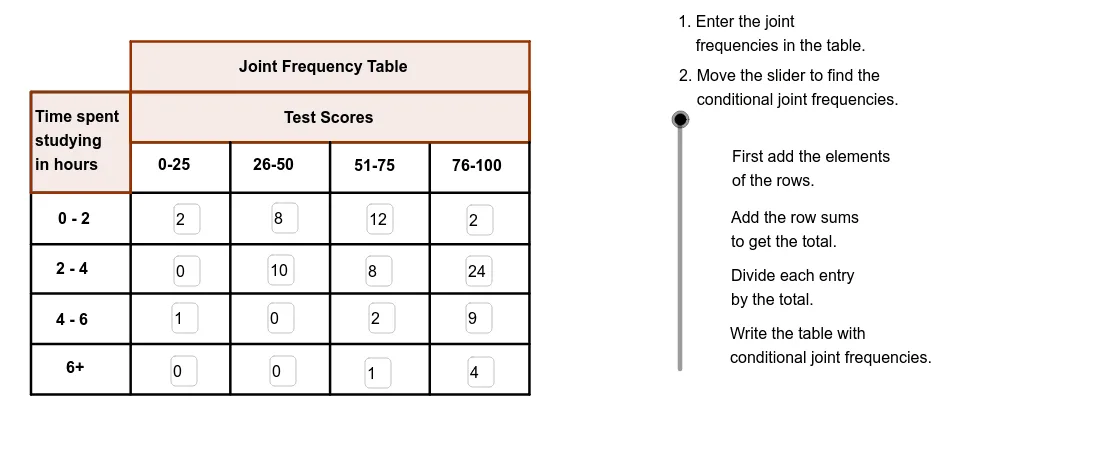
This example demonstrates Ms. Scanlon's survey on the relationship between students' study time and scores. The core mathematical concepts include statistical analysis and scatter plots. Using GeoGebra commands such as Segment, Intersect, Textfield, Polygon, and Vector, the relationship between study time and scores can be constructed. Suitable for 9th-grade students.
GeoGebra Commands & Parameters
Segment(M, K) → iSegment(A, M) → gIntersect(g, i) → M_1Textfield(B3) → IB3Textfield(B4) → IB4Textfield(C3) → IC3Textfield(C4) → IC4Textfield(D3) → ID3Textfield(D4) → ID4Textfield(E3) → IE3Textfield(E4) → IE4Segment(C, D) → bSegment(I, J) → eSegment(N, K) → hSegment(O, P) → jSegment(Q, R) → kSegment(S, T) → lPolygon(C, N, K, M) → poly1, n, p, q, rPolygon(C, U, O, A) → GradePoly, s, t, a_1, b_1Segment(A, S) → aSegment(K, T) → fVector(A_1, B_1) → uVector(C_1, D_1) → u_1Vector(E_1, F_1) → v_1Vector(G_1, H_1) → w_1Polygon(I_1, Z, M_1, L_1) → Title, d_1, e_1, f_1, g_1Segment(B, F) → cSegment(H, L) → dSegment(E, V) → mSegment(G, W) → c_1Textfield(B5) → IB5Textfield(B6) → IB6Textfield(C5) → IC5Textfield(C6) → IC6Textfield(D5) → ID5Textfield(D6) → ID6Textfield(E5) → IE5Textfield(E6) → IE6
AI Drawing Prompt Reference
Create a scatter plot to show the relationship between students' study time and scores. First, draw the coordinate axes, then plot several points representing different students' study time and scores, followed by connecting these points with lines. Finally, add titles and labels such as 'Study Time' and 'Scores'.
The prompt above was compiled from the original drawing commands and is for reference only.