
More Moments 3D: Visualizing Expected Value and Median Line in a Cuboid
Loading the math board and drawing, please wait…
In collections
Vector Mechanics & Statics
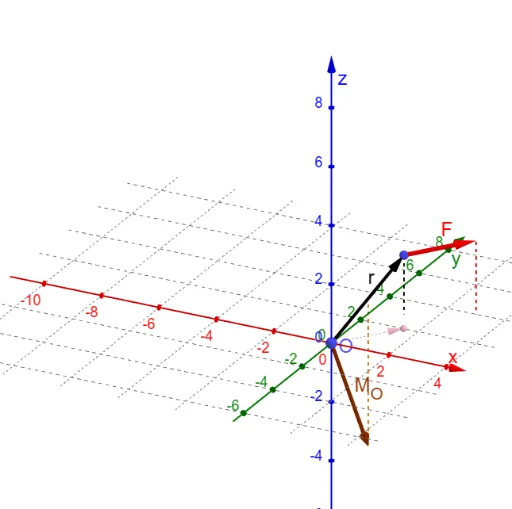
This GeoGebra example demonstrates the geometric interpretation of moments in three-dimensional space, using an interactive cuboid and sliders to visualize the relationship between the expected value (Expected Value) and the median line (Median Line). The core mathematical concepts involve definite integrals, geometric probability, moments of various orders, and 3D coordinate projections. The construction employs GeoGebra commands such as Vector, If, Polygon, Line, Angle, Length, Segment, and Textfield, along with objects like a slider (slide), line LOA, point C, vector r, auxiliary points (A_1, B_1, F, G, O), projection points, and coordinate variables (xr, yr, zr, etc.). It also uses functions f, moment M_O, and other dynamic elements to compute and display results interactively. This resource is suitable for high school to university students studying probability and statistics, calculus, or solid geometry, helping them grasp abstract concepts like moments and expected values through 3D visualization. It also serves as a valuable reference for educators creating interactive teaching materials.
GeoGebra Commands & Parameters
Vector(C) → rVector(C, B_1) → FVector(O, G) → r_1If(LOA, r_1, r) → r_sVector(A_1) → fPolygon(O, C, B_1, A_1) → q1, o, c, b, aLine(O, C) → gAngle(g, c) → θLength(F) → LFLength(r) → LrLength(M_O) → LMVector(C, D) → F_rVector(C, E) → F_pSegment(E, B_1) → hSegment(B_1, D) → iVector(G, H) → F_0Line(B_1, C) → jLength(r_1) → LrpAngle(O, G, H) → αSegment(Cxy, C) → lSegment(Fxy, B_1) → mSegment(Moxy, Mxyz) → nTextfield(A_1) → InputBox1Length(r_s) → r_{mag}Length(F_0) → F_{mag}Angle(G2, G, H) → βVector(G, G2) → rr