
Module 25: Probability and Normal Distribution Interactive Demo
Loading the math board and drawing, please wait…
①This GeoGebra example demonstrates probability concepts through random experiments, geometric probability, and the normal distribution curve, integrating parametric curves and angles. ②Core mathematical concepts include probability, stochastic processes, normal distribution, parametric equations, and geometric angles, showing how random variables and distributions can be visualized. ③Construction: The summary mentions object f, likely a function defining the normal density curve, possibly with sliders for parameters, and parametric curves to trace the distribution shape, while angles and geometry elements help illustrate probability areas. ④Suitable for high school to university courses in probability and statistics, useful for teaching normal distribution properties, simulating random experiments, and visualizing probability, also valuable for educators creating interactive materials.
GeoGebra Commands & Parameters
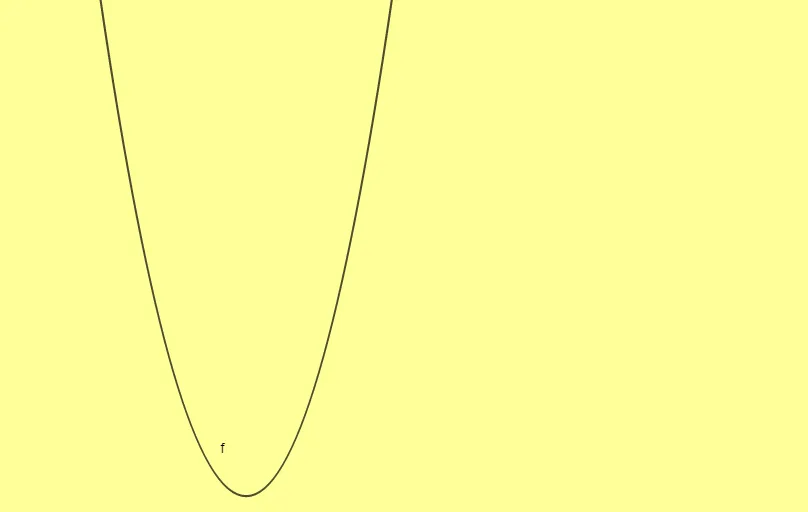
y = x^(2) - 5
AI Drawing Prompt Reference
Draw a normal distribution curve using parametric equations, adjust parameters with sliders. Also, plot a quadratic function y=x²-5 to illustrate geometric probability and random experiments. Finally, use angles and geometric elements to indicate probability areas, helping to visualize random variables and distributions.
The prompt above was compiled from the original drawing commands and is for reference only.