
Colorful Mystery Curves: Random Sequences and Parametric Visualization
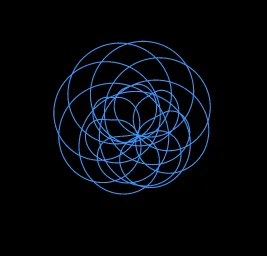
Loading the math board and drawing, please wait…
① This GeoGebra example generates a series of vibrant 'mystery curves' that demonstrate how random processes combined with parametric equations produce complex and beautiful planar shapes. ② Core mathematical concepts include random number generation, sequence summation, parametric (Cartesian) curves, complex numbers, and dynamic RGB color control, touching on probability/statistics, functions, and geometric transformations. ③ Construction highlights: uses Random, Sequence, Sum, and CurveCartesian commands; objects include buttons (button1/2/3), sliders (r, n, s, c), coordinate components (Cx, Cy, cX, cY, fx, fy), and color variables (R, G, B, O, Rb, Gb, Bb). Buttons trigger random redraws, enabling real-time changes in shape and color. ④ Suitable for high school to undergraduate mathematics instruction or recreational math exploration, ideal for teaching parametric equations, random processes, sequences, and function graphing, as well as an introductory example of programmatic geometric construction to spark interest in mathematical aesthetics.
GeoGebra Commands & Parameters
Random(1, 4) → rSequence(Random[-30, 30], i, 1, 4) → nSequence(RandomUniform[-2, 2], i, 1, 4) → CySequence(RandomUniform[-2, 2], i, 1, 4) → CxSequence((Element[Cx, i] * cos((Element[n, i] * x))) - (Element[Cy, i] * sin((Element[n, i] * x))), i, 1, 4) → cXSum(cX, r) → fxSequence((Element[Cx, i] * sin((Element[n, i] * x))) + (Element[Cy, i] * cos((Element[n, i] * x))), i, 1, 4) → cYSum(cY, r) → fyCurveCartesian(fx(t), fy(t), t, 0, s) → c
AI Drawing Prompt Reference
Create a series of colorful mystery curves by combining random numbers with parametric equations to demonstrate how random processes and parametric equations produce complex shapes. First, generate four random numbers as parameters, then create four random coordinate points, and calculate the sine and cosine functions for each point. Finally, sum these functions to get the final parametric equation curve. Use sliders to dynamically adjust the curve and buttons to trigger random redrawing, changing the shape and color in real-time.
The prompt above was compiled from the original drawing commands and is for reference only.