
Nigeria Data Fitting and Statistical Visualization Example
Loading the math board and drawing, please wait…
In collections
Confirmed Coronavirus Cases in Countries
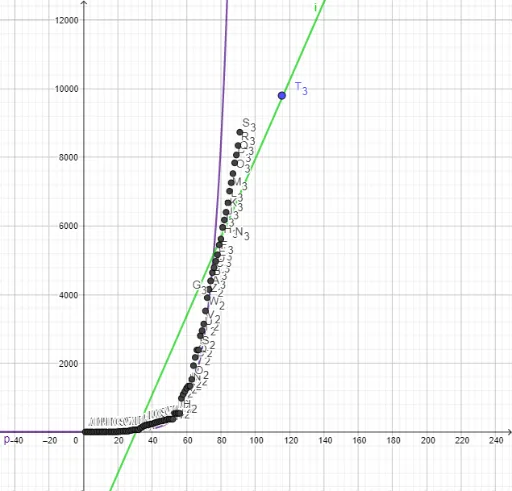
This GeoGebra example, themed around Nigeria, demonstrates comprehensive data analysis by fitting multiple models to a dataset and visualizing statistical summaries. It showcases the use of power fit (FitPow), linear regressions (FitLineY and FitLineX), and growth model fitting (FitGrowth) to explore trends, alongside boxplots and parametric curves for enhanced visualization. Core mathematical concepts include data fitting, regression analysis, statistical distribution, and parametric equations. The construction involves applying FitPow, FitLineY, FitLineX, and FitGrowth commands to 20 data points (A1 to B20) to generate different fitted curves, while boxplots summarize the data's spread and parametric curves may represent the fitted function trajectories. This example is suitable for high school or undergraduate statistics and mathematics courses, helping students understand data modeling, compare fitting methods, and master GeoGebra's statistical and fitting tools.
GeoGebra Commands & Parameters
FitPow(l1) → gFitLineY(l1) → hFitLineX(l1) → iFitGrowth(l1) → pFitPow(l1) → q
AI Drawing Prompt Reference
Create a statistical visualization themed around Nigeria, featuring a scatter plot of 20 data points. Fit four distinct curves to the same dataset: a power function curve, two linear regression lines (one treating y as dependent, the other treating x as dependent), and an exponential growth curve. Additionally, include two boxplots to summarize the data distribution, and use parametric curves to represent the fitted function trajectories. Ensure all curves and data points are visually distinct for easy comparison of different fitting methods.
The prompt above was compiled from the original drawing commands and is for reference only.