
Minimum Spanning Tree Generator and Calculator
Loading the math board and drawing, please wait…
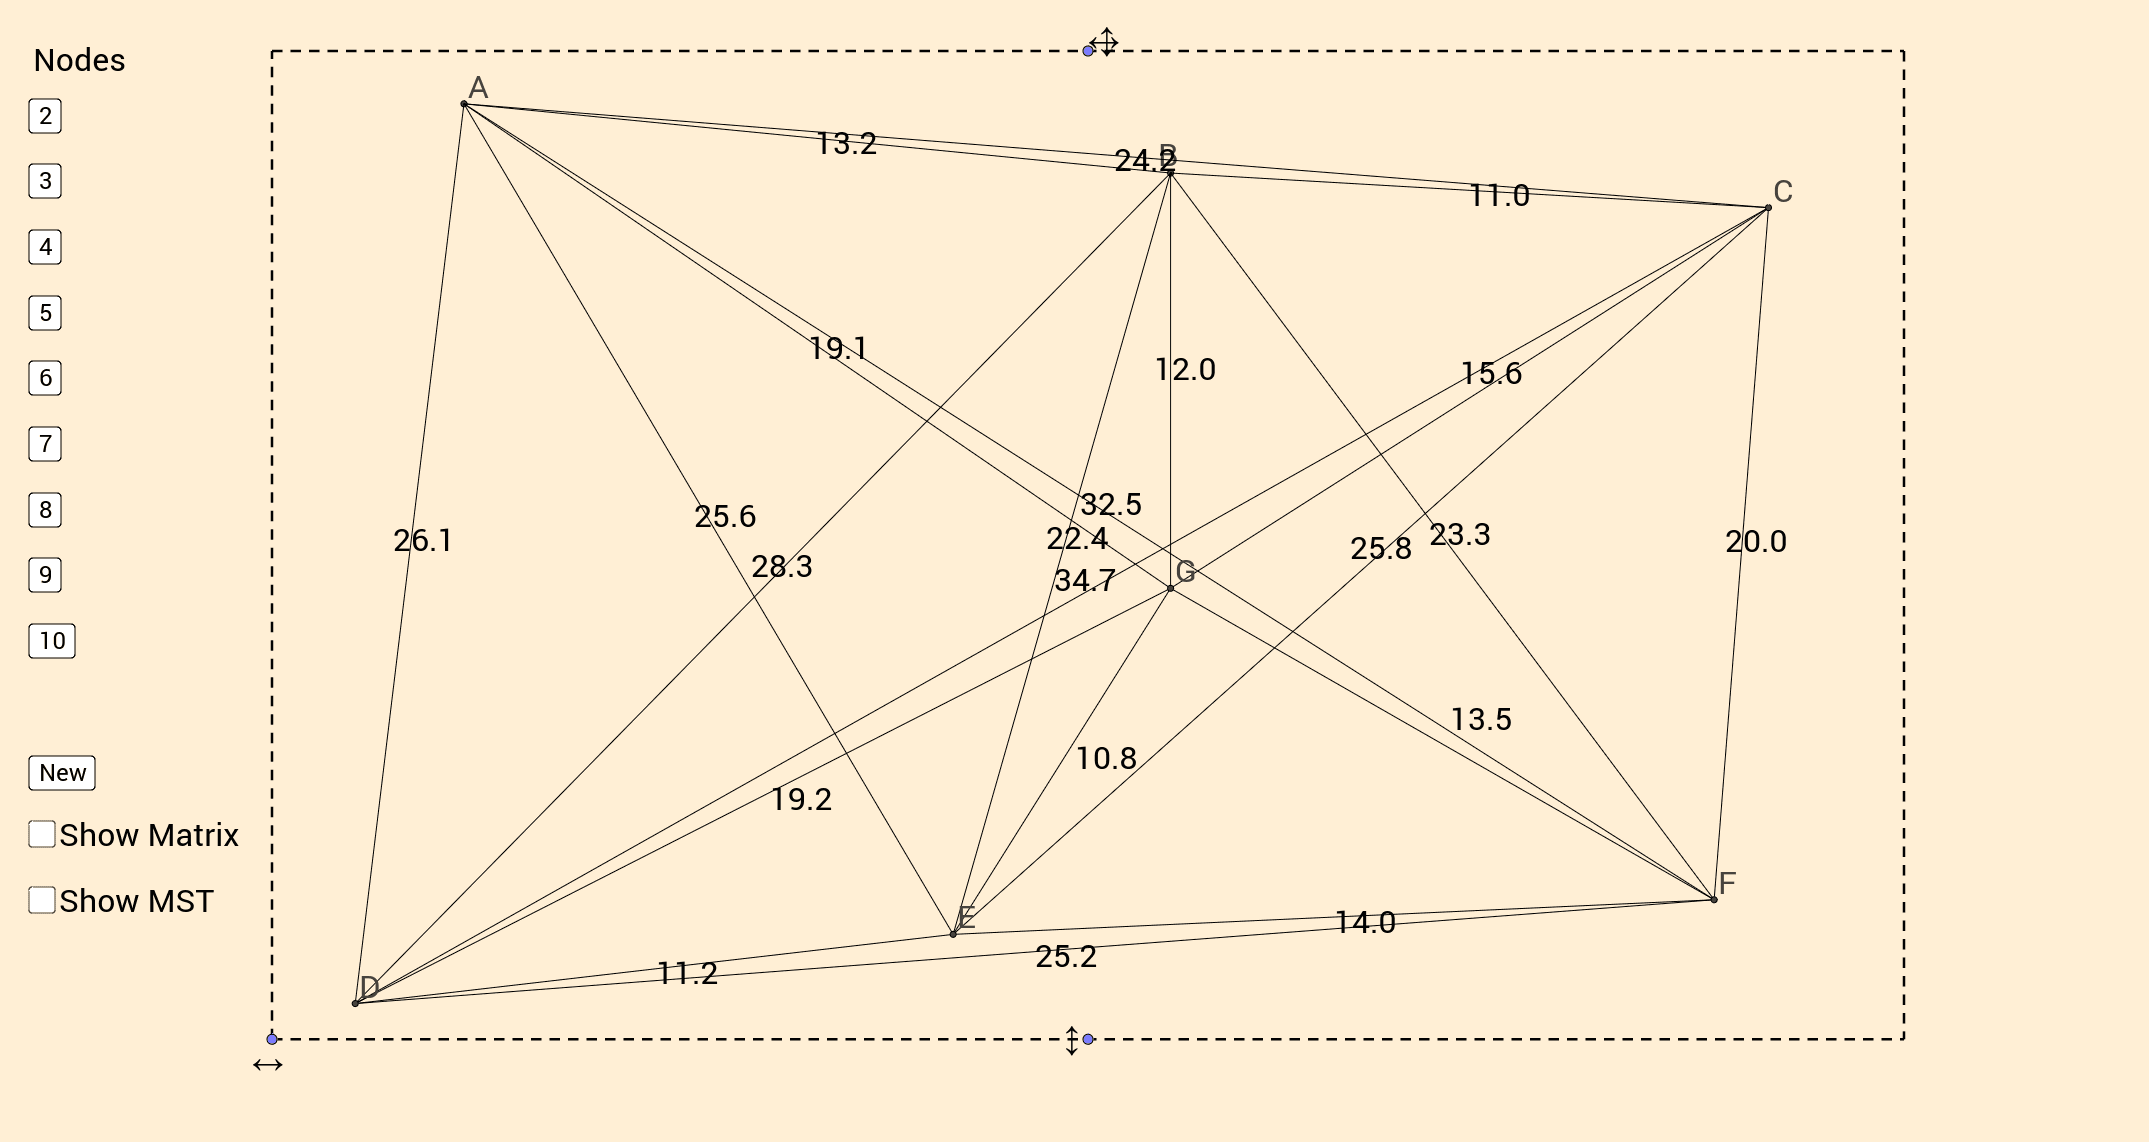
This example demonstrates the generation and calculation of Minimum Spanning Trees (MST) in graph theory, visually showing how to construct a tree connecting all vertices with the minimum total edge weight. Core mathematical concepts include graph theory, optimization, vertex connection, and edge weight comparison. It uses GeoGebra commands like Line, Point, Length, Segment, Intersect, LaTeX, and MinimumSpanningTree. Suitable for high school students and above learning graph algorithms, algorithm visualization, or as an introductory tool for computer science education.
GeoGebra Commands & Parameters
Line(B_1, yAxis) → gPoint(g) → D_1Line(D_1, xAxis) → iPoint(i) → A_1Line(G_1, yAxis) → hPoint(h) → C_1Length(Segment[D, G]) → dg_1Length(Segment[B, G]) → bg_1Length(Segment[B, D]) → bd_1Length(Segment[A, G]) → ag_1Length(Segment[A, B]) → ab_1Length(Segment[A, D]) → ad_1Length(Segment[B, C]) → bc_1Length(Segment[A, C]) → ac_1Length(Segment[C, G]) → cg_1Length(Segment[C, D]) → cd_1Length(Segment[D, E]) → de_1Length(Segment[C, E]) → ce_1Length(Segment[B, E]) → be_1Length(Segment[A, E]) → ae_1Length(Segment[E, G]) → eg_1Length(Segment[F, G]) → fg_1Length(Segment[D, F]) → df_1Length(Segment[B, F]) → bf_1Length(Segment[A, F]) → af_1Length(Segment[C, F]) → cf_1Length(Segment[E, F]) → ef_1Segment(A, B) → abLine(A_1, yAxis) → fLine(B_1, xAxis) → jIntersect(j, f) → F_1Intersect(h, i) → H_1Segment(F_1, G_1) → kSegment(G_1, H_1) → lSegment(A_1, H_1) → mSegment(A_1, F_1) → nSegment(A, C) → acSegment(B, C) → bcSegment(A, D) → adSegment(B, D) → bdSegment(C, D) → cdLaTeX(matrix, true) → text1Segment(A, E) → aeSegment(A, F) → afSegment(B, E) → beSegment(B, F) → bfSegment(C, E) → ceSegment(C, F) → cfSegment(D, E) → deSegment(D, F) → dfSegment(E, F) → efSegment(A, G) → agSegment(B, G) → bgSegment(C, G) → cgSegment(D, G) → dgSegment(E, G) → egSegment(F, G) → fgMinimumSpanningTree({A, B, C, D, E, F, G}) → graph
AI Drawing Prompt Reference
Create a graph theory illustration for demonstrating minimum spanning tree algorithms. Start by setting up coordinate axes and placing several movable points on them. Connect these points with line segments to form multiple triangles and quadrilaterals, creating a weighted connected graph. The figure should include multiple vertices connected by segments, with each segment labeled by its length as the edge weight. The overall layout should clearly show the connections between vertices and emphasize the concept of a minimum spanning tree—connecting all vertices with minimal total edge weight. Include a coordinate grid for easy observation of point positions and distances.
The prompt above was compiled from the original drawing commands and is for reference only.