
Maximizing Cuboid Volume
Loading the math board and drawing, please wait…
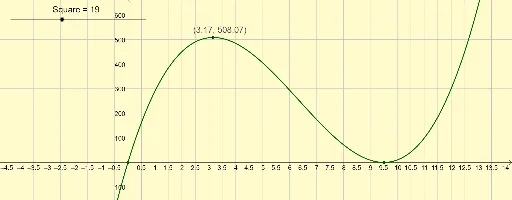
This example demonstrates how to maximize the volume of a cuboid by adjusting its edge lengths. Key mathematical concepts include the volume formula of a cuboid and the problem of finding extrema. Using GeoGebra commands such as If and Extremum, a dynamic cuboid model is constructed to show how the volume changes with edge lengths. Suitable for high school mathematics education and learning.
GeoGebra Commands & Parameters
If(Min[list4] ≥ 0, 0 - (Max[list4] * 0.3), (Min[list4] * 1.3)) → yminIf(Max[list4] > 0, (Max[list4] * 1.3), 0 + (Min[list4] * 0.3)) → ymaxIf(Max[list2] > 0, (Max[list2] * 1.5), 0 + (Min[list2] * 0.5)) → xmaxIf(Min[list2] ≥ 0, 0 - (Max[list2] * 0.5), (Min[list2] * 1.5)) → xminExtremum(f) → A, B
AI Drawing Prompt Reference
Draw a dynamic cuboid model showing how its volume changes with varying edge lengths. Use sliders to control the edge lengths and calculate the volume accordingly. Plot a function graph to represent the volume's change with edge lengths, highlighting the maximum point. Adjust the coordinate axis range for a clear display.
The prompt above was compiled from the original drawing commands and is for reference only.