
Identifying Quadratic Functions from Roots
Loading the math board and drawing, please wait…
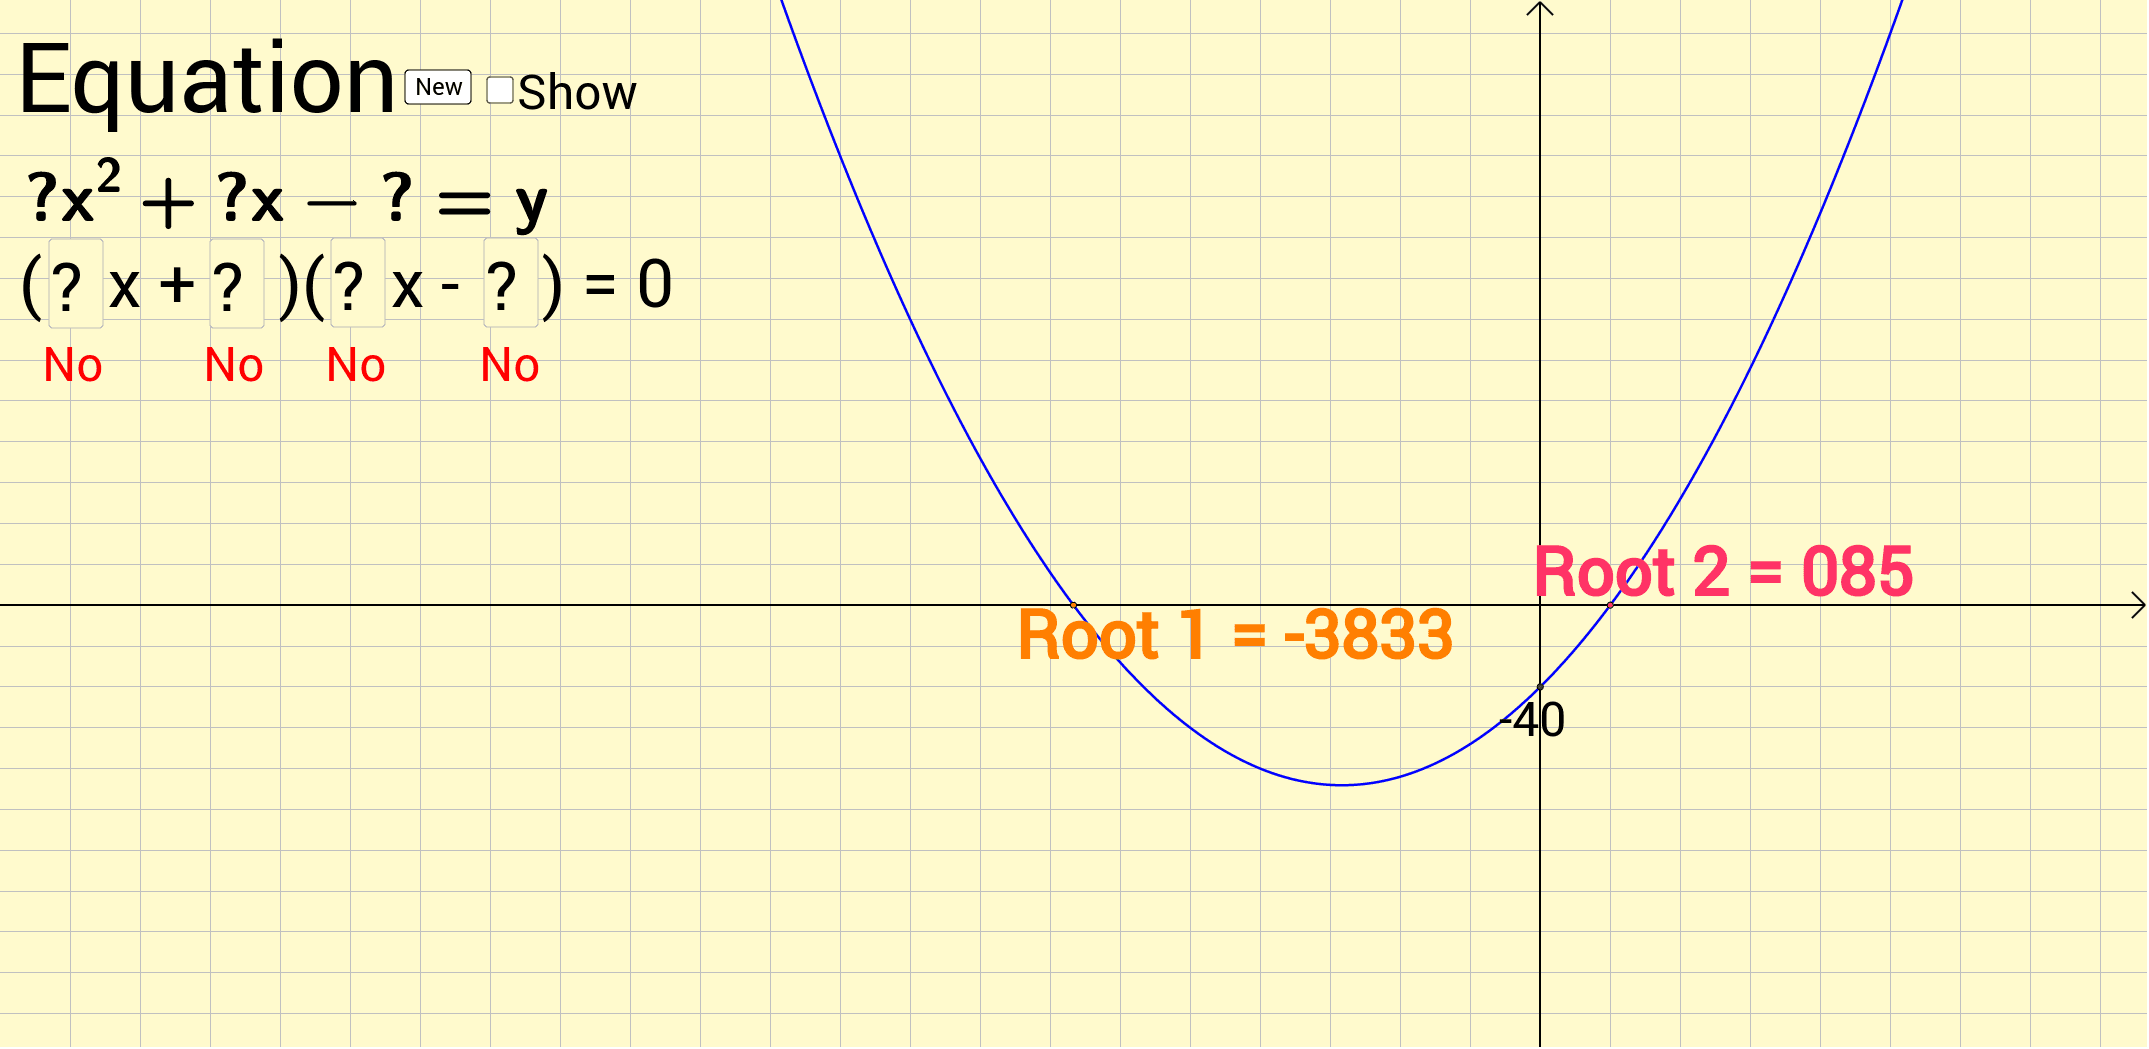
This example demonstrates how to graph quadratic functions based on their roots, analyzing symmetry and vertex positions. Key math concepts include quadratic functions, roots, axis of symmetry, vertex, and discriminant. GeoGebra commands used are Random for generating random roots, If for conditional logic, Textfield for displaying text, Root for root calculation, and Extremum for finding vertex. Suitable for high school mathematics education to understand the properties of quadratic functions and the impact of parameters a, b, c on the graph.
GeoGebra Commands & Parameters
Random(-10, 10) → bRandom(1, 9) → aRandom(1, 9) → cRandom(-10, 10) → dIf((a * d) + (b * c) < 0, (-((a * d) + (b * c))), (a * d) + (b * c)) → BIf((b * d) < 0, ((b * d) * (-1)), (b * d)) → CIf((a * d) + (b * c) < 0, "-", "+") → sign1If((b * d) < 0, "-", "+") → sign2If(b < 0, "- ", "+") → sign3If(d < 0, "- ", "+") → sign4Textfield(ansA) → InputBox1Textfield(ansB) → InputBox2Textfield(ansC) → InputBox3Textfield(ansD) → InputBox4Root(f) → L, MExtremum(f) → NRandom(-10, 10) → b_1Random(1, 9) → a_1Random(1, 9) → c_1Random(-10, 10) → d_1If((a * d) + (b * c) < 0, "-", "+") → sign1_1If((b * d) < 0, "-", "+") → sign2_1
AI Drawing Prompt Reference
Graph a quadratic function to illustrate its roots, axis of symmetry, and vertex position, analyzing the impact of parameters a, b, c. Generate random values for a, b, c, d, calculate the roots and vertex, then plot the function and mark the roots, axis of symmetry, and vertex, displaying parameter values and calculations.
The prompt above was compiled from the original drawing commands and is for reference only.