
Discount Calculation Practice: Percent, Price, and Linearity
Loading the math board and drawing, please wait…
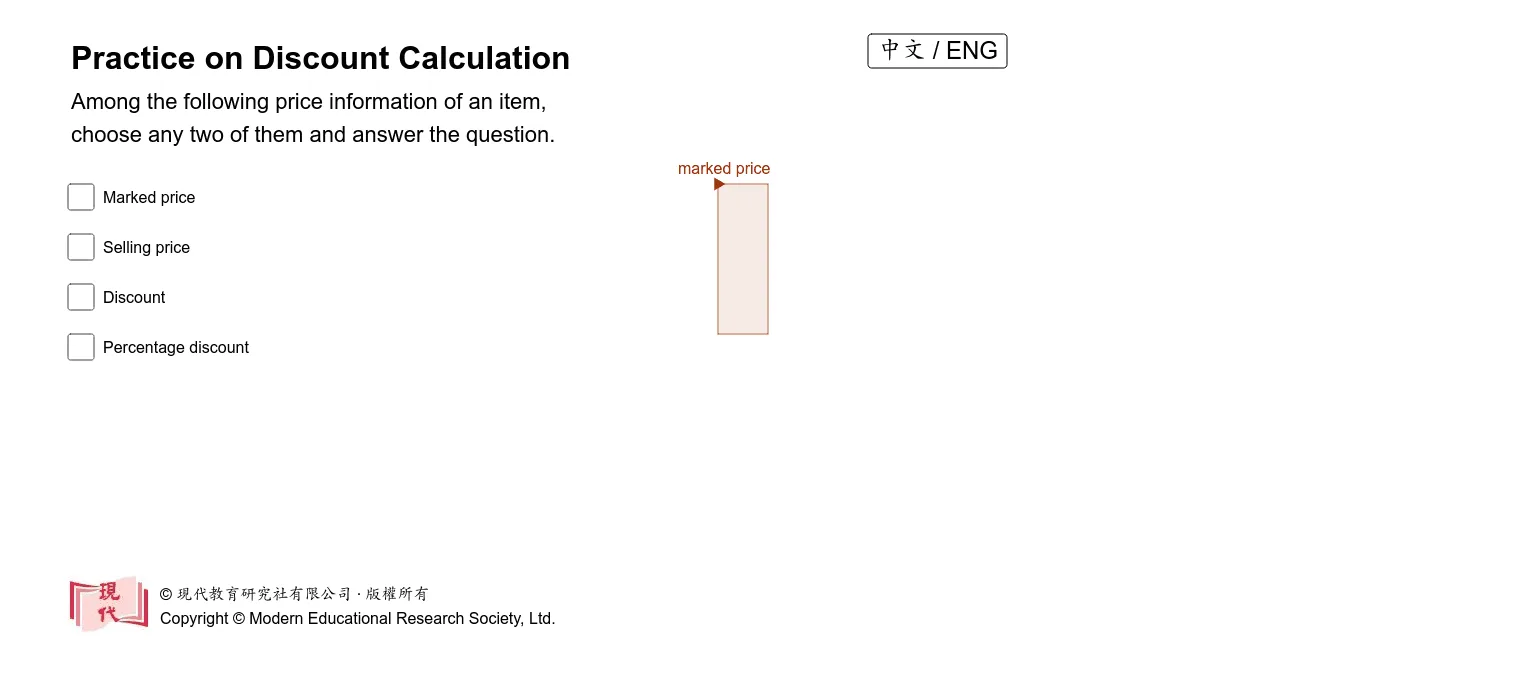
This example uses an interactive GeoGebra setup to demonstrate the linear relationship among original price, selling price, and the discount amount/rate, showing visually how changing the discount affects the final price. The main mathematical ideas include percentage conversion, arithmetic operations, linear (straight-line) modeling of quantitative relationships, and reading values from constructed geometric objects. Construction highlights: Random is used to generate practice parameters (e.g., prices or rates); Intersect determines key intersection points to obtain the corresponding price values; Polygon and Segment build the visual structure representing price parts and intervals; Vector helps express relationship directions/quantities; and If applies conditional rules for discount computation and displayed outcomes. Key objects include MarkedPrice, SellingPrice, and Discount for original price, final price, and discount value, while labeled points (such as A, B, C, D and related sets) anchor the straight-line relationships used for interpretation. button1 and ItemCount support interactive practice switching/iteration. Suitable for middle-school mathematics practice on percentages and linear relationships, and for classroom demonstration or self-study.
GeoGebra Commands & Parameters
Random(1, 100) → bIntersect(xAxis, yAxis) → APolygon(A, B, C, D) → q1, a_1, b_1, c, dVector(F, E) → uPolygon(C, D, E, G) → q2, c_1, d_1, e, gPolygon(C, D, E, G) → q3, c_2, d_2, e_1, g_1If(f, 1, 0) → f_{1}If(h, 1, 0) → h_{1}If(i, 1, 0) → i_{1}If(j, 1, 0) → j_{1}Segment(A, E) → l
AI Drawing Prompt Reference
Draw a graphic demonstrating discount calculation practice, including original price, selling price, and discount value. The graphic should show linear relationships, percentage conversion, and arithmetic operations. The construction order includes: randomly generating practice parameters, determining key intersection points, building visual structures, expressing relationship directions, and applying conditional rules to compute and display discount results.
The prompt above was compiled from the original drawing commands and is for reference only.