
Visualization and Geometric Construction of Functions of Two Variables
Loading the math board and drawing, please wait…
In collections
Learn GeoGebra Classic
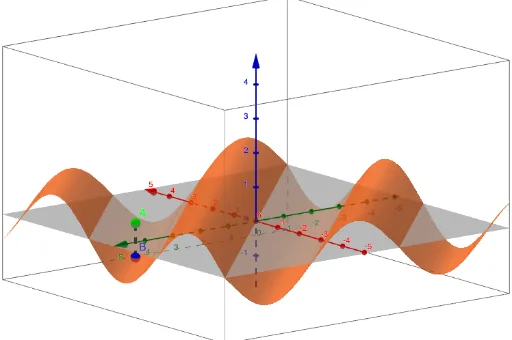
①This example demonstrates the graphical representation of a function of two variables in 3D space, using GeoGebra's geometric construction tools to show the relationship between the function surface and related geometric elements. ②Core mathematical concepts include bivariate functions, 3D surfaces, parametric representation, and geometric transformations such as rotation and parallelogram construction, involving the interaction between function graphs and geometric objects. ③Construction highlights: from the construction summary, the Segment command is used to create segments, and objects f (function), A (point), a (parameter), and B (point) are defined, building a visualization framework for the function through these basic elements, possibly using sliders or parameters to control the function's shape. ④Suitable for high school to university-level mathematics teaching, for understanding multivariable calculus, spatial geometry, and dynamic mathematical exploration, as well as for intuitive demonstrations of optimization problems.
GeoGebra Commands & Parameters
Segment(A, (x(A), y(A), f(x(A), y(A)))) → a
AI Drawing Prompt Reference
Draw a 3D graph of a bivariate function, create a line segment a using point A and the function value at point A, show the relationship between the function surface and geometric elements, use parameters to control the function shape, perform rotations and parallelogram constructions to aid in understanding multivariable calculus and spatial geometry.
The prompt above was compiled from the original drawing commands and is for reference only.