
Median-Median Line vs. LSRL for Nine Points
Loading the math board and drawing, please wait…
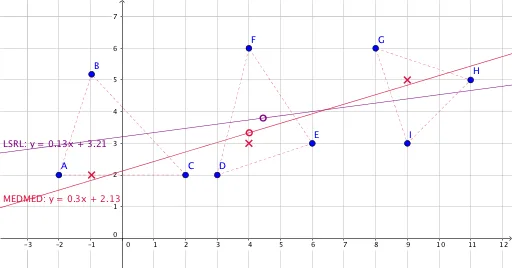
This example demonstrates the comparison between the Median-Median Line and the Least Squares Regression Line (LSRL) using nine data points. It involves core mathematical concepts such as regression analysis, median, least squares method, and data fitting. Key GeoGebra commands used include FitLineY for fitting, Sort, Take, Centroid, ConvexHull, and Line to construct the Median-Median Line, while also showing the LSRL. Suitable for high school mathematics education to understand the characteristics and applications of different regression methods.
GeoGebra Commands & Parameters
FitLineY({A, B, C, D, E, F, G, H, I}) → LSRLSort(data) → list1Take(list1, 1, 3) → list2Take(list1, 4, 6) → list3Take(list1, 7, 9) → list4Centroid(Polygon[K, L, M]) → NSort({K, L, M}) → mmmConvexHull(list2) → graph1ConvexHull(list3) → graph2ConvexHull(list4) → graph3Line(Centroid[Polygon[{K, L, M}]], Line[Element[mmm, 1], Element[mmm, 3]]) → MEDMED