
Median and Mean Visualization
Loading the math board and drawing, please wait…
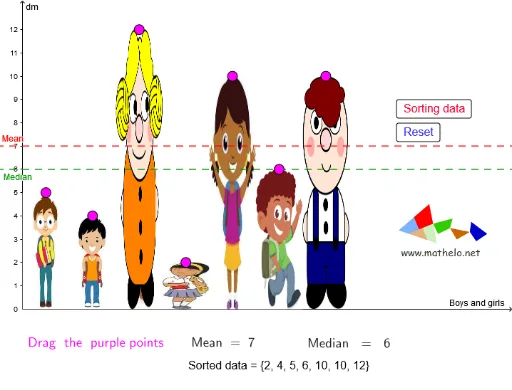
This example dynamically demonstrates the positional relationship between the median and mean in a data set. Core math concepts include median, mean, statistical data analysis. Construction highlights the use of GeoGebra commands/objects like Point, Ray, Zip, Sort, IndexOf, mean, Median. Suitable for high school and above learners to understand statistical distribution properties and geometric interpretations.
GeoGebra Commands & Parameters
Point(xAxis) → GRay(G, v) → lPoint(l) → GGPoint(xAxis) → ARay(A, v) → fPoint(f) → AAPoint(xAxis) → FRay(F, v) → kPoint(k) → FFPoint(xAxis) → ERay(E, v) → jPoint(j) → EEPoint(xAxis) → DRay(D, v) → iPoint(i) → DDPoint(xAxis) → CRay(C, v) → hPoint(h) → CCPoint(xAxis) → BRay(B, v) → gPoint(g) → BBZip(y(P), P, lijst1) → lijst2Sort(lijst1, lijst2) → lijst11IndexOf(AA, lijst11) → iAIndexOf(BB, lijst11) → iBIndexOf(CC, lijst11) → iCIndexOf(DD, lijst11) → iDIndexOf(EE, lijst11) → iEIndexOf(FF, lijst11) → iFIndexOf(GG, lijst11) → iGmean(data) → gemMedian(data) → medSort(data) → sortda
AI Drawing Prompt Reference
Draw a number line and place points G, AA, BB, CC, DD, EE, FF from left to right. Then draw perpendicular rays from each point. Next, sort these points by their values and find the 4th, 5th, 6th, and 7th points. Calculate the mean and median of all points.
The prompt above was compiled from the original drawing commands and is for reference only.