
Covid-19 Situation Report: March 1, 2020 Exponential Growth Model
Loading the math board and drawing, please wait…
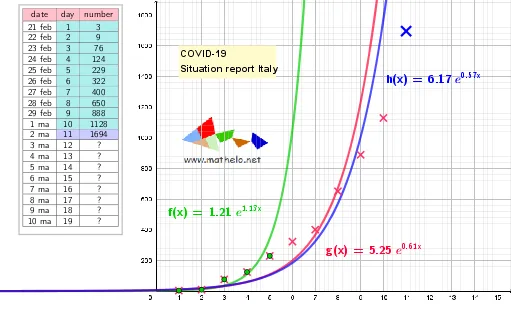
This example demonstrates the exponential growth of the coronavirus on March 1, 2020, using a simplified model. The core mathematical concepts include exponential functions. The FitExp command is used to fit the data, and the TableText command generates the table. Suitable for high school mathematics education, particularly for teaching exponential functions and growth models.
GeoGebra Commands & Parameters
FitExp(dag5) → fLaTeX(f, true, true) → tekst3FitExp(dag10) → gLaTeX(g, true, true) → tekst4FitExp(dag11) → hLaTeX(h, true, true) → tekst5TableText({{A1, B1, C1}, {A2, B2, C2}, {A3, B3, C3}, {A4, B4, C4}, {A5, B5, C5}, {A6, B6, C6}, {A7, B7, C7}, {A8, B8, C8}, {A9, B9, C9}, {A10, B10, C10}, {A11, B11, C11}, {A12, B12, C12}, {A13, B13, C13}, {A14, B14, C14}, {A15, B15, C15}, {A16, B16, C16}, {A17, B17, C17}, {A18, B18, C18}, {A19, B19, C19}, {A20, B20, C20}}, "|_ccc") → tekst1
AI Drawing Prompt Reference
Draw an exponential growth model for the coronavirus situation on March 1, 2020. First, use the FitExp command to fit the data and generate an exponential function f. Then, use the LaTeX command to convert function f to LaTeX format and display it in text box tekst3. Next, repeat the above steps to generate two new exponential functions g and h, and display them in text boxes tekst4 and tekst5 respectively. Finally, use the TableText command to generate a table with 19 data points and display it in text box tekst1.
The prompt above was compiled from the original drawing commands and is for reference only.