
Measures of Central Tendency: Interactive GeoGebra Exploration of Mean, Median,
Loading the math board and drawing, please wait…
In collections
Statistics and Probability with Mr Downes
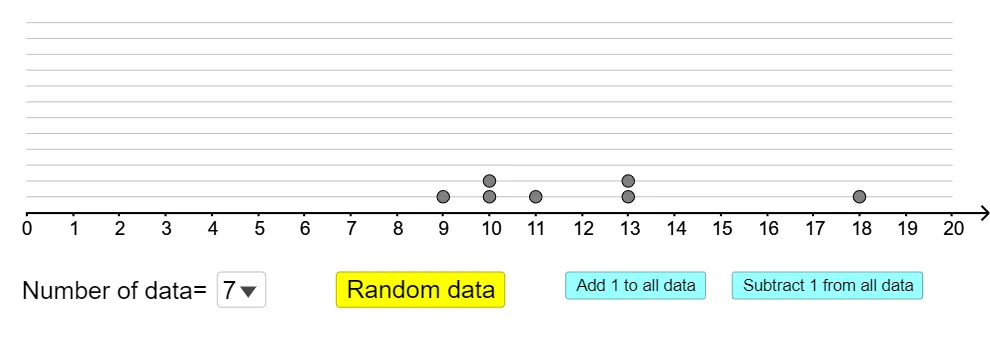
This GeoGebra example interactively demonstrates the three main measures of central tendency: mean, median, and mode. Learners can input or generate random data, and the construction uses commands such as Sequence, Shuffle, Sort, mean, median, and mode to build the data list and compute the statistics on the fly. The interface includes sliders to adjust the data range, buttons to recalculate, and text objects (textMean, textMedianOdd, textMedianEven, listMode) to display results. It is designed for middle‑school statistics lessons and introductory data‑analysis courses, providing a visual and hands‑on way to understand how central tendency is calculated and interpreted.
GeoGebra Commands & Parameters
SelectedElement(listNx) → nXSequence(Segment[(0, i), (20, i)], i, seperation, (12 * seperation), seperation) → listGridXPoint(listGridX) → APoint(listGridX) → BPoint(listGridX) → CPoint(listGridX) → DPoint(listGridX) → EPoint(listGridX) → FPoint(listGridX) → GPoint(listGridX) → HPoint(listGridX) → IPoint(listGridX) → JPoint(listGridX) → KPoint(listGridX) → LSort(listDataX) → listDataXsortedmean(listDataX) → meanXIf(nX ≥ 11, 0.7, If[nX ≥ 9, 0.85, 1]) → scaleMedian(listDataX) → q2Ray((0, 0), (1, 0)) → bPoint(b) → Q_2Vector(Q_2, Q_2 + (0, 0.8)) → vSequence(Text[Element[If[sorted, listDataXsorted, listDataX], i]] + "+", i, 1, nX - 1) → list1Mode(listDataX) → listModeSequence(Random[0, 20], i, 1, nX) → listRandFrequency(listRand) → listFreqSort(listRand) → listRandSortFlatten(Zip[Sequence[(seperation * i), i, 1, k], k, listFreq]) → listHeightShuffle(Zip[(h, k), h, listRandSort, k, listHeight]) → listPosition, {(8, 0.4), (0, 0.4), (15, 0.4), (12, 0.4), (11, 0.4), (5, 0.4), (15, 0.8)}Segment((meanX, 0), (meanX, 4)) → sMeanSegment((q2, 0), (q2, 3.5)) → sMedianZip(Segment[(k, 0), (k, 3)], k, listMode) → listModeSegment
AI Drawing Prompt Reference
Create a drawing that features a series of horizontal lines forming a grid from x=0 to x=20, spaced evenly. Mark twelve points along these lines. Add a bar chart where each bar is positioned at the x‑coordinate of a random data value and its height corresponds to the frequency of that value. Include vertical line segments at the mean, median, and mode positions to illustrate these measures of central tendency, and add text labels showing the data values and the computed statistics.
The prompt above was compiled from the original drawing commands and is for reference only.