
Mean and Outliers
Loading the math board and drawing, please wait…
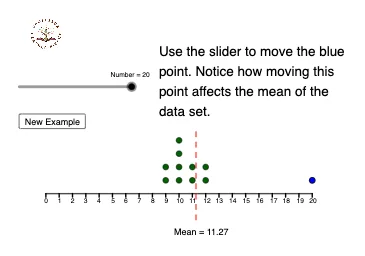
This example demonstrates the visual impact of outliers on the mean calculation. It involves core concepts like mean computation, outlier identification, and statistical characteristics. Constructed using commands such as Segment, Sequence, Append, DotPlot, and mean in GeoGebra, it visualizes data points and mean with outliers. Suitable for high school statistics and probability education to understand data distribution properties.
GeoGebra Commands & Parameters
Segment((0, 1), (20, 1)) → cSegment((0, 0), (20, 0)) → fSequence(Segment[(f, 0), (f, -0.25)], f, 0, 20, 1) → L_1, {0.25, 0.25, 0.25, 0.25, 0.25, 0.25, 0.25, 0.25, 0.25, 0.25, 0.25, 0.25, 0.25, 0.25, 0.25, 0.25, 0.25, 0.25, 0.25, 0.25, 0.25}Append(list2, x(A)) → list3DotPlot(list3) → L_2mean(list3) → mSegment((m, -2), (m, 5)) → g
AI Drawing Prompt Reference
Draw a coordinate system with x-axis from 0 to 20 and y-axis from -2 to 5. Draw two parallel horizontal lines, one at y=1 and one at y=0. Starting from y=0, draw line segments downward at intervals of 0.25 units until reaching x=20. Connect all these points with line segments, then add a point on the x-axis and represent all points with a dot plot. Calculate the mean of all points and draw a vertical line through the mean value on the coordinate system to show the impact of outliers on the data distribution.
The prompt above was compiled from the original drawing commands and is for reference only.