
Solving Logarithmic Equations
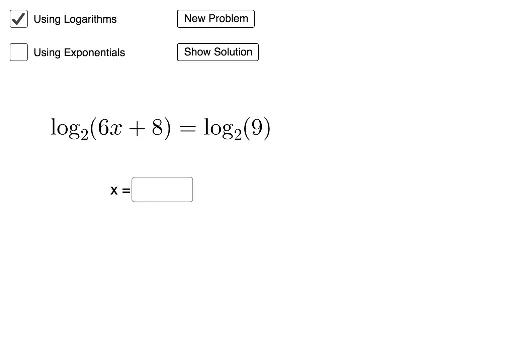
Loading the math board and drawing, please wait…
This example demonstrates the process and geometric interpretation of solving logarithmic equations. It involves core mathematical concepts such as logarithmic functions, exponential functions, geometric mean, and optimization problems. Construction highlights include using commands like RandomElement, Random, Textfield, and Vector to create interactive elements and random equations. Suitable for high school and above mathematics learners to understand the solution methods and visualizations of logarithmic equations.
GeoGebra Commands & Parameters
RandomElement({2, 3, 4, 5, 6}) → base1Random(2, 6) → aRandom(1, 9) → bRandom(5, 19) → cTextfield(sol1) → InputBox1Vector(A, B) → uVector(C, D) → vRandom(1, 5) → eTextfield(sol2) → InputBox2Vector(E, F) → wVector(G, H) → hVector(I, J) → i
AI Drawing Prompt Reference
Create an interactive educational diagram for solving logarithmic equations. Show two logarithmic curves and one exponential curve intersecting at several points. Place two input boxes near the curves for entering solutions. Draw multiple arrowed vectors from intersection points toward axes or other curves to illustrate the geometric meaning of solutions. Scatter some numeric labels in the background representing equation parameters. Keep the layout clear, emphasizing the relationship between logarithmic and exponential functions and the visual solution process.
The prompt above was compiled from the original drawing commands and is for reference only.