
Math and News: What is a Coronavirus? — Geometric Modeling of a Virus
Loading the math board and drawing, please wait…
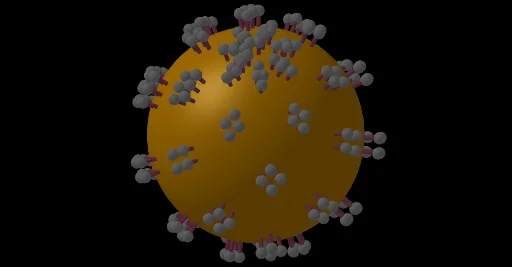
This GeoGebra example turns a news topic into an interactive mathematical model, demonstrating how a coronavirus's spiky surface can be represented using 3D geometry and functions. It visualizes the distribution of spike proteins on a sphere, highlighting symmetry and structure. Core math concepts include spheres, tangent functions, right triangles, straight lines, polygons, and spatial transformations. The construction uses commands such as Intersect, Mirror, CurveCartesian, Circle, Sequence, Join, and Sphere, with objects like B_1, O_1, m_1, and color-coded parts (Red, Green, Blue) to distinguish components. Suitable for high school and above, this example connects current events with solid geometry, trigonometry, and parametric curves, making it ideal for STEM lessons, mathematical modeling, or public science communication.
GeoGebra Commands & Parameters
Intersect(xAxis, yAxis) → O_1Mirror(O, HH) → O'Mirror(HH, O) → N_1Mirror(GG, O) → NCurveCartesian(x(O + (f1(t) * u) + (f2(t) * v) + (f3(t) * w)), y(O + (f1(t) * u) + (f2(t) * v) + (f3(t) * w)), t, (-L_2), L_2) → gCircle(O, Rad, xOyPlane) → k_1Circle(O, Rad, xOyPlane) → dSequence(Sequence[(x(O), y(O)) + ((((a + b) * cos(i° + j° + t)) * cos(i° - j° + t)) * u) + ((((a + b) * sin(i° + j° + t)) * cos(i° - j° + t)) * v) + (((a + b) * sin(i° - j° + t)) * w), i, 0, 360, Mutation], j, 0, k, Mutation) → liste12Sequence(Sequence[(x(O), y(O)) + (((a * cos(i° + j°)) * cos(i° - j°)) * u) + (((a * sin(i° + j°)) * cos(i° - j°)) * v) + ((a * sin(i° - j°)) * w), i, 0, 360, Mutation], j, 0, k, Mutation) → liste13Join(liste12) → liste14Join(liste13) → liste15Sequence(Segment[Element[liste14, i], Element[liste15, i]], i, 1, Length[liste14]) → liste16Sphere(O, a) → i
AI Drawing Prompt Reference
Visualize a 3D sphere with symmetric spike proteins modeled using trigonometric functions and parametric curves, highlighting geometric patterns. Mark the intersection of the sphere with coordinate axes as the origin, then create symmetric spikes through mirroring and rotations, colored red, green, and blue to distinguish components. The structure combines straight lines and curves, demonstrating the application of trigonometry, solid geometry, and spatial transformations, ideal for STEM education and mathematical modeling.
The prompt above was compiled from the original drawing commands and is for reference only.