
Match the Least Squares Regression Line
Loading the math board and drawing, please wait…
In collections
AP Statistics
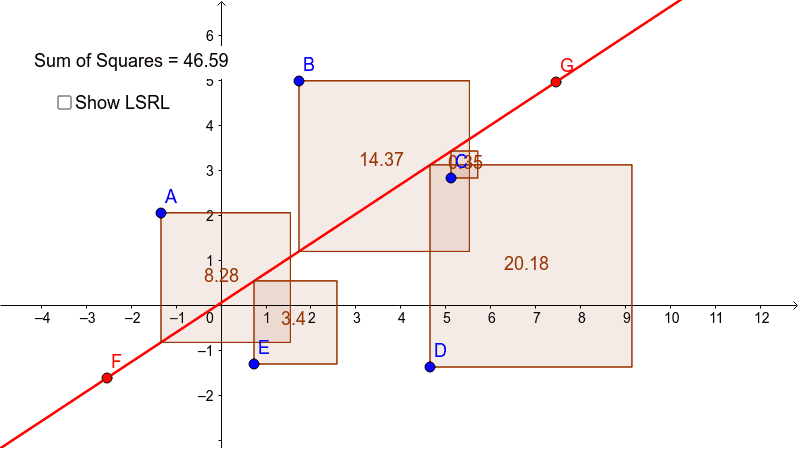
This example demonstrates how to drag the red line to minimize the sum of squared areas, identifying the best fit line. Core concepts include Least Squares Regression, Linear Regression, and Data Fitting. Constructed using GeoGebra commands like Line, OrthogonalLine, Intersect, Polygon, Sum, and FitLineY. Suitable for high school and above learning statistical regression analysis.
GeoGebra Commands & Parameters
Line(F, G) → aOrthogonalLine(A, xAxis) → bOrthogonalLine(E, xAxis) → cOrthogonalLine(B, xAxis) → dOrthogonalLine(D, xAxis) → eOrthogonalLine(C, xAxis) → fIntersect(b, a) → HIntersect(c, a) → IIntersect(d, a) → JIntersect(a, f) → KIntersect(e, a) → LPolygon(A, H, 4) → poly1, g, h, i, j, M, NPolygon(I, E, 4) → poly2, k, l, m, n, O, PPolygon(B, J, 4) → poly3, p, q, r, s, Q, RPolygon(L, D, 4) → poly4, t, a_1, b_1, c_1, S, TPolygon(K, C, 4) → poly5, d_1, e_1, f_1, g_1, U, VSum(A1:A5) → A6FitLineY({A, B, C, D, E}) → h_1
AI Drawing Prompt Reference
Draw a coordinate system with five sets of data points and their vertical distances. Drag a red line to minimize the sum of squared vertical distances from all points to the line, which represents the best fit line. Show the five polygons formed by connecting the intersection points of the red line with the data points, and highlight the relationships between these intersection points and the original data points.
The prompt above was compiled from the original drawing commands and is for reference only.