
Mapping Diagrams and Graphs for Exponential and Logarithmic Functions
Loading the math board and drawing, please wait…
In collections
Mapping Diagrams: From AB to C&DE, Resource
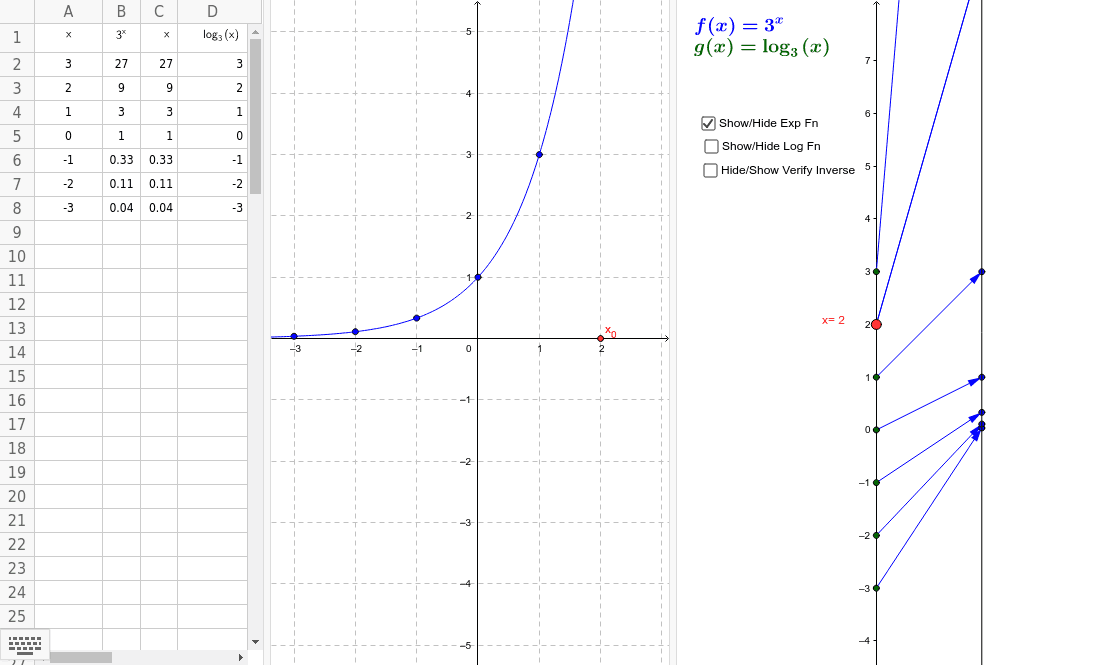
This example demonstrates the mapping diagrams and graphs for exponential and logarithmic functions. It involves core math concepts like exponential functions, logarithmic functions, mapping diagrams, function graphs, derivatives, and definite integrals. Constructed using GeoGebra commands and objects such as Point, Vector, Textfield, and Sequence, it is suitable for high school students and educators to illustrate and understand function properties.
GeoGebra Commands & Parameters
Point(yAxis) → A_1Vector(A_1, B) → uTextfield(f) → inputBox1Sequence(Vector[(0, k), (2, f(k))], k, -3, 3) → ExpMDSequence((2, f(k)), k, -3, 3) → ExpTargPtsSequence((0, k), k, -3, 3) → SourcePtsMDSequence((k, f(k)), k, -3, 3) → ExpGraphptsVector(A_1, B_2) → vSequence(Vector[(0, f(k)), (2, g(f(k)))], k, -3, 3) → logMDSequence((f(k), k), k, -3, 3) → logGraphptsSequence(Vector[(2, k), (4, f(k))], k, -3, 3) → InvLogMDVector(B_2, A_2) → w
AI Drawing Prompt Reference
Draw a mapping diagram and graph for exponential and logarithmic functions, including lines connecting source and target points, and function graph points, first draw vertical lines for mapping, then function graphs, finally combine them to show function properties.
The prompt above was compiled from the original drawing commands and is for reference only.