
Mapping Diagram for Complex Integration over a Circle
Loading the math board and drawing, please wait…
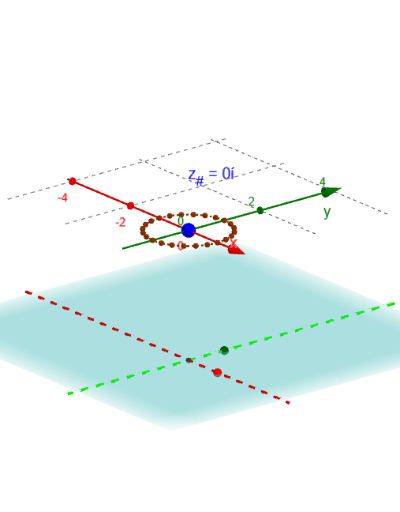
This GeoGebra example dynamically illustrates the mapping diagram for a complex integral along a circular path. It visualizes how points on the integration contour (a circle) are mapped by a complex function to the image plane, using vector fields and locus traces to show the Riemann-sum approximation of the integral. Core mathematical concepts include complex integration, parametrized curves, complex mappings, vector fields, and discretization of the integration path. Construction highlights: Sequence generates discrete sample points, Circle defines the contour, Line and Vector draw mapping arrows, Locus traces the image points, ToComplex converts coordinates to complex numbers, and Textfield/InputBox allow interactive input of the function and parameters. This is suitable for university-level complex analysis courses or advanced undergraduates, and serves as a powerful teaching tool for instructors to demonstrate the geometric meaning and numerical approximation of complex line integrals.
GeoGebra Commands & Parameters
Sequence(0, n) → NTextfield(F) → InputBox1Expand(Simplify[F(x + (y * ί), 0, x(a_#) + (y(a_#) * ί), 0, x(b_#) + (y(b_#) * ί), 0)]) → GzZip(t_a + (k * dt), k, N) → t_*Zip((δ * ℯ^((t * ί))) + z_#, t, t_*) → z_*Circle(z_#, δ) → cZip(Gr(x(z), y(z)) + (Gi(x(z), y(z)) * ί), z, z_*) → fz_*Zip((x(z), y(z), ht), z, fz_*) → gpt_*Line(O, ZS1) → YaxLine(O, ZR1) → XaxZip(Vector[A, B], A, z_*, B, gpt_*) → gvec_*Vector(z_#, Gz1_#) → vecg_#Point(c) → ALocus(PtAG, A) → fLocSequence(Element[z_*, k + 1] - Element[z_*, k], k, 1, n) → dzSequence((Element[fz_*, k] * Element[dz, k]), k, 1, n) → fdz_*Sequence(Sum[fdz_*, k], k, 1, n) → Sumfdz_*ToComplex(Sum[fdz_*, n]) → EstIntZip(ToComplex[A], A, Sumfdz_*) → SumComx_*Zip((x(A), y(A), ht), A, SumComx_*) → Sumfdz3_*Zip(Vector[A, B], A, z_*, B, Sumfdz3_*) → SumVec_*Textfield(t_a) → InputBox2Textfield(t_b) → InputBox3