
Map Coloring - Four Color Problem
Loading the math board and drawing, please wait…
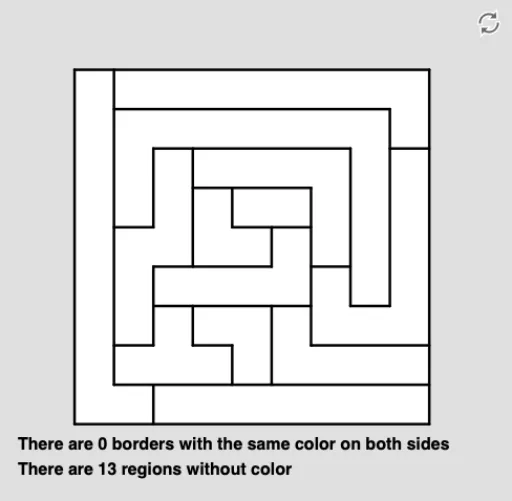
This example demonstrates the application of the Four Color Theorem in map coloring, requiring the user to color regions so that no two adjacent regions share the same color. Key math concepts include graph theory, the Four Color Theorem, adjacency relations, and region partitioning. Construction involves commands like Segment for drawing boundaries, Polygon for forming regions, Sum for region summation, and CountIf for color usage statistics. Suitable for high school students, computer science enthusiasts, and those interested in graph theory.
GeoGebra Commands & Parameters
Segment(A, C) → l_4Segment(C, Q_1) → k_5Segment(Q_1, O_1) → l_5Segment(O_1, A) → m_5Segment(B, E) → n_5Segment(D, H) → p_5Segment(D, P_1) → q_5Segment(I, J) → r_5Segment(J, U) → s_5Segment(O, R) → t_5Segment(P, K) → a_5Segment(K, L) → b_5Segment(L, F) → c_5Segment(Q, G) → d_5Segment(M, N) → f_6Segment(Z, A_1) → g_6Segment(A_1, H_1) → h_6Segment(H_1, J_1) → i_6Segment(I_1, V) → j_6Segment(U, W) → k_6Segment(W, C_1) → l_6Segment(B_1, D_1) → m_6Segment(F_1, B_1) → n_6Segment(E_1, G_1) → p_6Segment(G_1, M) → e_5Segment(X, Y) → q_6Segment(J_1, S) → r_6Segment(S, T) → s_6Segment(T, N_1) → t_6Segment(K_1, L_1) → a_6Segment(M_1, N_1) → b_6Polygon(B_1, D_1, G_1, F_1) → polígono1, b_7, d_6, g_7, f_7Polygon(V, W, C_1, B_1, F_1, E_1) → polígono2, v_3, w_3, c_6, b_8, f_8, e_6Polygon(O, R, D_1, C_1, W, U) → polígono3, o_3, r_7, d_7, c_7, w_4, u_3Polygon(X, Y, J_1, I_1, E_1, G_1) → polígono4, a_2, r_9, j_7, i_7, e_7, g_8Polygon(I, J, U, V, I_1, H_1, A_1, Z) → polígono5, i_8, j_8, u_4, v_4, i_9, h_7, a_7, z_4Polygon(D, F, L, K, P, O, J, I) → polígono6, d_8, f_9, l_7, k_7, p_7, o_4, j_9, i_{10}Polygon(F, G, Q, P, K, L) → polígono7, f_{10}, g_9, q_7, p_8, k_8, l_8Polygon(G, H, N, M, R, Q) → polígono8, g_{10}, h_8, n_7, m_7, r_8, q_8Polygon(M, N, L_1, K_1, T, S, Y, X) → polígono9, m_8, n_8, l_9, k_9, t_7, s_7, s_9, t_9Polygon(S, T, N_1, M_1, Z, A_1, H_1, J_1) → polígono10, s_8, t_8, n_9, m_9, z_5, a_8, h_9, j_{10}Polygon(K_1, L_1, Q_1, P_1, M_1, N_1) → polígono11, k_{10}, l_{10}, q_9, p_9, m_{10}, n_{10}Polygon(A, B, E, D, P_1, O_1) → polígono12, a_9, b_9, e_8, d_9, p_{10}, o_5Polygon(B, C, H, E) → polígono13, b_{10}, c_8, h_{10}, e_9Sum(frontera) → fmCountIf(ip ≟ 0, ip, pais) → pb
AI Drawing Prompt Reference
Draw a map coloring example demonstrating the Four Color Theorem. Sketch multiple regions and boundary lines, ensuring adjacent regions have different colors. First, draw all the boundary lines, then fill in the regions, and finally color each region with different colors to illustrate the theorem. The map includes several interconnected regions that need careful coloring.
The prompt above was compiled from the original drawing commands and is for reference only.