
Magnifying Glass on Cosine Function and Riemann Sums
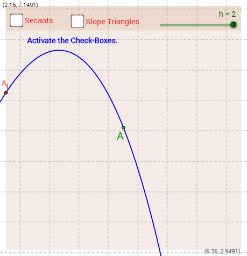
Loading the math board and drawing, please wait…
① This example demonstrates a draggable 'magnifying glass' window that zooms into a local region of the cosine function graph, while simultaneously displaying the corresponding Riemann sums (upper and lower sums) as bar charts. ② Core mathematical concepts include trigonometric functions (cosine), Riemann sums (upper and lower), bar charts, and plane figures, helping students understand the geometric meaning of integral approximation. ③ Construction highlights: using GeoGebra commands such as Textfield, Point, Polygon, Segment, Line, and If to build the interactive interface; objects include function f, text field, point A, parameter h, magnifier (Lupe), multiple polygons (Ar, Al, StDreieck, etc.), auxiliary segments (sek_l, sek_r), and sliders (sl, sr) for dynamically adjusting interval and partition count. ④ Suitable for high school or pre-university students learning introductory calculus, function graphs, and numerical integration, as well as for teachers demonstrating the convergence of Riemann sums in class.
GeoGebra Commands & Parameters
Textfield(f) → Textfeld1Point(f) → APolygon(A + ((-h), (-h)), A + (h, (-h)), A + (h, h), A + ((-h), h)) → Lupe, i, j, k, lPolygon(A, Ar, A_r) → StDreieckre_1, a, g, mPolygon(Al, A_l, A) → StDreieckli, n, p, qSegment(A_l, Al) → bSegment(Al, A) → cSegment(A, Ar) → dSegment(A + (h, (-h)), A + (2 * (h, (-h)))) → griff1Line(A_l, A) → sek_lLine(A, A_r) → sek_rSegment(A + (min, (-min)), A + (2 * (min, (-min)))) → griff2If(h > min, griff1, griff2) → griffPolygon(F, G, D, E) → Vieleck4, f_2, g_2, d_2, e_2
AI Drawing Prompt Reference
Draw a draggable magnifying glass window that zooms into a local region of a cosine function curve around a selected point. Inside the window, show an enlarged view of the curve. Beside the window, display upper and lower Riemann sums as bar charts with colored rectangles representing interval partitions. Extend two auxiliary lines from the center point to the left and right neighboring sample points, forming two small triangles. The magnifier has a retractable handle whose length adjusts with the window size. The overall layout includes the cosine curve, the magnifier, bar charts, triangles, and auxiliary segments, illustrating the geometric meaning of integral approximation.
The prompt above was compiled from the original drawing commands and is for reference only.