
Definite Integral Illustrator (I) by noor88m99
Loading the math board and drawing, please wait…
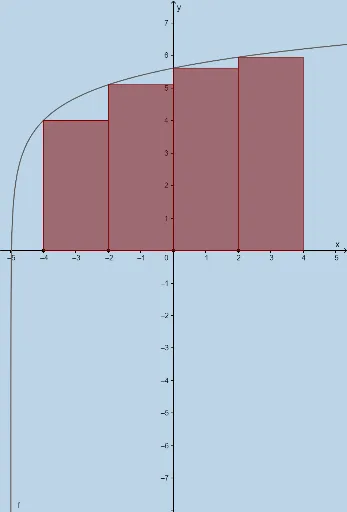
① This example dynamically illustrates the geometric meaning of the definite integral as the area under a curve, and demonstrates the Riemann sum approximation process. ② Core mathematical concepts include definite integrals, Riemann sums (left and right), partition number, interval subdivision, function evaluation, and area approximation. ③ Construction highlights: using GeoGebra commands such as Textfield, Sequence, Translate, LeftSum, Sum, Intersect, Polygon, and Integral, it builds objects like function f, endpoints a and b, number of subdivisions n, rectangles, midpoints, left/right endpoints, and sum values, with interactive sliders and input boxes. ④ Suitable for high school and early college students learning calculus, to visualize the definition of the definite integral and the convergence of Riemann sums, and for classroom demonstrations.
GeoGebra Commands & Parameters
Textfield(f) → InputBox1Textfield(a) → InputBox2Textfield(b) → InputBox3Sequence((a + (i * deltax), 0), i, 1, n, 1) → rightxSequence((a + (i * deltax), f(a + (i * deltax))), i, 1, n, 1) → fofrightxSequence((a + (i * deltax), 0), i, 0, n - 1, 1) → leftxSequence(Midpoint[Element[leftx, i], Element[rightx, i]], i, 1, n, 1) → midpointsSequence((a + (i * deltax), f(a + (i * deltax))), i, 1, n, 1) → list1Translate(list1, (deltax, 0)) → list1'LeftSum(f, a, b, n) → lSequence(x = x(Element[midpoints, i]), i, 1, n, 1) → list2Sequence(Intersect[f, Element[list2, i], (3, 6.079441541679836)], i, 1, n, 1) → list3Translate(list3, (deltax / 2, 0)) → midpointtoprightTranslate(list3, (((-deltax)) / 2, 0)) → midpointtopleftTranslate(midpoints, (deltax / 2, 0)) → midpoints'Translate(midpoints, (((-deltax)) / 2, 0)) → midpoints'_1Sequence(Polygon[Element[midpoints'_1, i], Element[midpoints', i], Element[midpointtopright, i], Element[midpointtopleft, i]], i, 1, n, 1) → list4Sum(list4) → hTranslate(list1, ((-deltax), 0)) → list1'_1Translate(rightx, ((-deltax), 0)) → rightx'Sequence(Polygon[Element[rightx, i], Element[list1, i], Element[list1'_1, i], Element[rightx', i]], i, 1, n, 1) → rightrectanglesumSum(rightrectanglesum) → jIntersect(k, p) → FIntersect(m, k) → GPolygon(D, E, G, F) → poly1, d_1, e, g_1, f_1Intersect(m, q) → HIntersect(p, q) → IPolygon(D, E, H, I) → poly2, d_2, e_1, h_1, i_1Intersect(p, r) → JIntersect(r, m) → KPolygon(D, E, K, J) → poly3, d_3, e_2, k_1, j_1Integral(f, a, b) → s
AI Drawing Prompt Reference
Draw a coordinate plane with a smooth function curve. Mark two endpoints on the x-axis defining an interval. Divide the interval into several equal subintervals, and construct three sets of rectangles: left-endpoint, right-endpoint, and midpoint rectangles, all approximating the area under the curve. Also shade the exact area under the curve between the endpoints. Include input boxes for the function and endpoints, plus a slider for the number of subdivisions, to show how the rectangle sums converge to the exact integral as subdivisions increase.
The prompt above was compiled from the original drawing commands and is for reference only.