
Limited Growth
Loading the math board and drawing, please wait…
In collections
ICME 13, TSG 46: Growth and Modelling with KUMULATOR
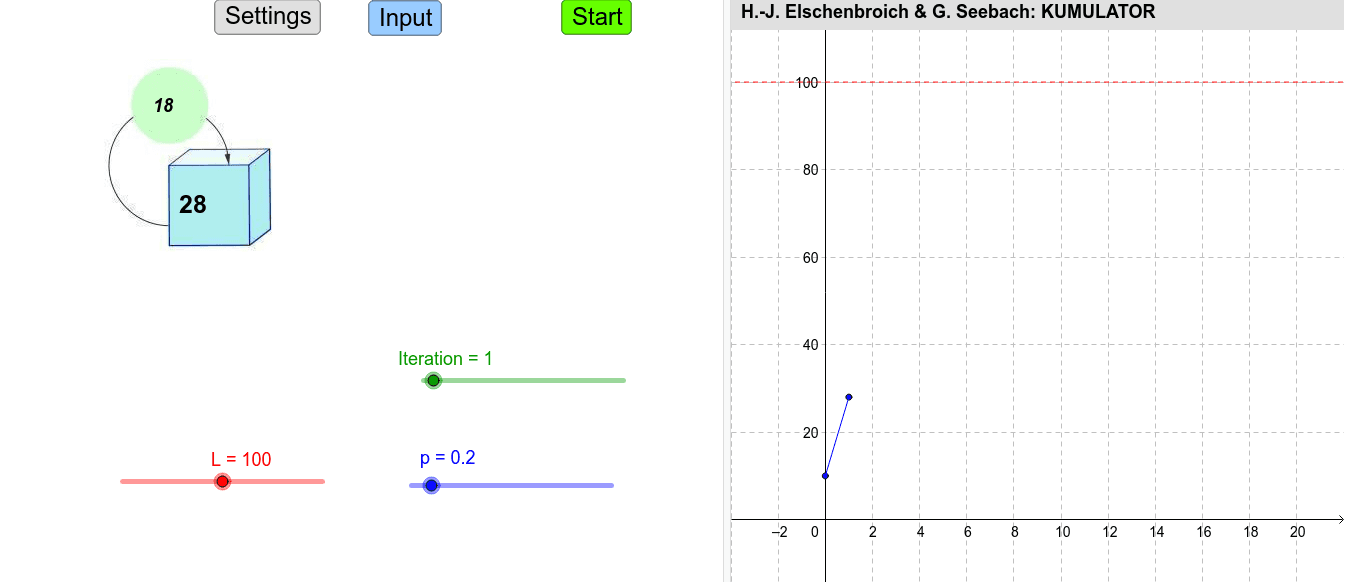
This example demonstrates the mathematical model of limited growth; core concepts include arithmetic, congruence, similar triangles, mode, and rhombus; construction highlights from the summary involve commands/objects like Textfield, LaTeX, First, PolyLine, Element, Polygon, Segment, Sequence, If; suitable for high school mathematics teaching, demonstrating and exploring limited growth models.
GeoGebra Commands & Parameters
Textfield(ST) → TxtSTTextfield(ET) → TxtETTextfield(SA) → TxtSATextfield(SB) → TxtSBTextfield(SC) → TxtSCTextfield(vA) → TxtvATextfield(vB) → TxtvBTextfield(vC) → TxtvCLaTeX(vA, false, false) → TextvALaTeX(vB, false, false) → TextvBLaTeX(vC, false, false) → TextvCFirst(Sequence[(Element[L_T, i + 1], Element[L_A, i + 1]), i, 0, n + 1], Iteration + 1) → L_{TAE}PolyLine(L_{TAE}) → Str_{AE}PolyLine(L_{TBE}) → Str_{BE}PolyLine(L_{TCE}) → Str_{CE}Element(L_A, Iteration + 1) → Bestand_AElement(L_B, Iteration + 1) → Bestand_BElement(L_C, Iteration + 1) → Bestand_CElement(L_{vA}, Iteration) → Aenderung_AElement(L_{vB}, Iteration) → Aenderung_BElement(L_{vC}, Iteration) → Aenderung_CFirst(Sequence[(Element[L_T, i + 1], Element[L_{vA}, i + 1]), i, 0, n], Iteration) → L_{TvAE}PolyLine(L_{TvAE}) → Str_{vAE}PolyLine(L_{TvBE}) → Str_{vBE}PolyLine(L_{TvCE}) → Str_{vCE}Element(L_{TCE}, Iteration) → DrAElement(L_{TCE}, Iteration + 1) → DrCPolygon(DrA, DrB, DrC) → Dreieck_C, dr3, dr2, dr1Element(L_{TvCE}, Iteration) → vCESegment(TX, vCE) → Strecke_{vC}Sequence((Element[L_T, i + 1], Element[L_A, i + 1]), i, 0, n) → L_{TAG}Sequence((Element[L_T, i + 1], Element[L_{vA}, i + 1]), i, 0, n - 1) → L_{TvAG}If(b, 1, 5) → dPolyLine(L_{TAG}) → Str_{AG}PolyLine(L_{TvAG}) → Str_{vAG}PolyLine(L_{TBG}) → Str_{BG}PolyLine(L_{TvBG}) → Str_{vBG}PolyLine(L_{TCG}) → Str_{CG}PolyLine(L_{TvCG}) → Str_{vCG}
AI Drawing Prompt Reference
Draw a geometric diagram illustrating a limited growth model, including three text labels for three changing quantities, three polyline lines showing the trend of these quantities, and three line segments connecting the starting and ending points, finally forming a triangle with three points to demonstrate the properties of similar triangles.
The prompt above was compiled from the original drawing commands and is for reference only.