
Maclaurin Series: Sine Function
Loading the math board and drawing, please wait…
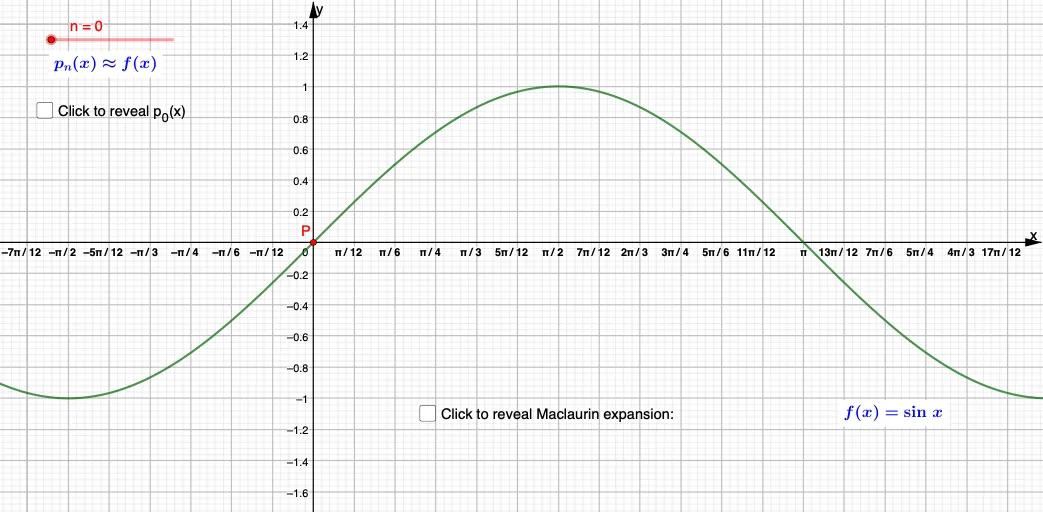
This example demonstrates the Maclaurin series expansion of the sine function. Using GeoGebra, users can visually see how polynomial functions approximate the sine function. Key mathematical concepts include functions, trigonometry, and series. By using commands like Point, Object, Text, etc., users can dynamically adjust the number of series terms and observe the approximation effect. Suitable for high school mathematics education and learning.
GeoGebra Commands & Parameters
Point(P_1) → BPoint(P_2) → CPoint(P_3) → DPoint(P_4) → EPoint(P_5) → F
AI Drawing Prompt Reference
Draw the Maclaurin series expansion of the sine function to show how polynomial functions approximate the sine function. Start by plotting several points and connect them to form the curve of the sine function and its polynomial approximations, creating a dynamic effect suitable for high school mathematics education and learning.
The prompt above was compiled from the original drawing commands and is for reference only.