
LR3-02-CYU2: Determine Equivalence of Linear Representations
Loading the math board and drawing, please wait…
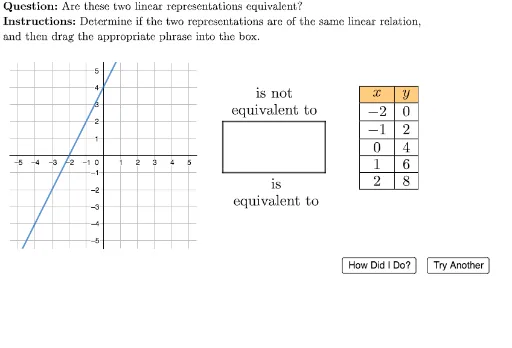
This interactive GeoGebra example asks students to determine whether two given linear representations (such as systems of linear equations or matrix forms) are equivalent. The core mathematical concept is linear representation equivalence, focusing on comparing solution sets. The construction uses GeoGebra commands like Polygon to create a cuboid or rectangular region, UnicodeToLetter and LaTeX for mathematical notation, Random and If to generate random problems, IsInRegion to test point membership, and TableText for data display. Interactive buttons (TryAnother) and feedback objects (correct, incorrect) provide self-assessment. Suitable for high school or early college linear algebra courses to reinforce the concept of equivalent linear systems.
GeoGebra Commands & Parameters
Polygon(A, B, C, D) → box, a, b, c, d_1UnicodeToLetter(10007) → xmarkUnicodeToLetter(10003) → cmarkPolygon(anchorEquivalent, anchorEquivalent + (widthOfEquivalent, 0), anchorEquivalent + (widthOfEquivalent, (-heightOfEquivalent)), anchorEquivalent + (0, (-heightOfEquivalent))) → dragBoxEquivalent, f, g, h, iPolygon(anchorNotEquivalent, anchorNotEquivalent + (widthOfNotEquivalent, 0), anchorNotEquivalent + (widthOfNotEquivalent, (-heightOfNotEquivalent)), anchorNotEquivalent + (0, (-heightOfNotEquivalent))) → dragBoxNotEquivalent, j, k, l, mIsInRegion(midAnchorEquivalent, box) → isEquivalentInRegionIsInRegion(midAnchorNotEquivalent, box) → isNotEquivalentInRegionIf(Random[0, 1] ≟ 0, Random[-4, -1], Random[1, 4]) → slope1Random(-5, 5) → intercept1Random(0, 1) → samenessIndicatorIf(samenessIndicator ≟ 0, slope1, If[Random[0, 1] ≟ 0, Random[-4, -1], Random[1, 4]]) → slope2If(samenessIndicator ≟ 0, intercept1, Random[-5, 5]) → intercept2Zip(line1(A), A, xValues) → yValues1Zip(line2(A), A, xValues) → yValues2TableText({Join[{{LaTeX["\cellcolor{#ffcc80}{x}"]}, xValues}], Join[{{LaTeX["\cellcolor{#ffcc80}{y}"]}, yValues1}]}, "|_vc") → table1TableText({Join[{{LaTeX["\cellcolor{#ffcc80}{x}"]}, xValues}], Join[{{LaTeX["\cellcolor{#ffcc80}{y}"]}, yValues2}]}, "|_vc") → table2LaTeX(("y=" * Polynomial[line1])) → equation1LaTeX(("y=" * Polynomial[line2])) → equation2Random(1, 4) → typeLaTeX((((((((((("\text{The two representations are of the same linear relation if they\\have identical values for the slope and \(y\)-intercept. The first representation has a\\slope of \(" * slope1) * "\) and a \(y\)-intercept of \(") * intercept1) * "\). The second representation has a slope of \(") * slope2) * "\) and a\\\(y\)-intercept of \(") * intercept2) * "\). \textbf{Therefore, they are ") * If[¬areSame, "not ", ""]) * "equivalent.}}")) → feedbackLaTeX("\text{Please drag a phrase into the box.}") → errorNoneDraggedLaTeX("\text{Only drag one phrase into the box.}") → errorBothDraggedLaTeX("\text{\textbf{Question: }Are these two linear representations equivalent?\\\textbf{Instructions: }Determine if the two representations are of the same linear relation,\\and then drag the appropriate phrase into the box.}") → TEXT
AI Drawing Prompt Reference
Create an interactive educational diagram showing two tables of x and y values for two linear equations, with their slopes and intercepts displayed. Below, place two drag-and-drop boxes labeled 'Equivalent' and 'Not Equivalent' for students to classify the relationship. Include a rectangular background area and feedback text explaining the equivalence condition. The layout should be clean and suitable for classroom use.
The prompt above was compiled from the original drawing commands and is for reference only.