
Logarithmic Functions (0,1) Base Demo
Loading the math board and drawing, please wait…
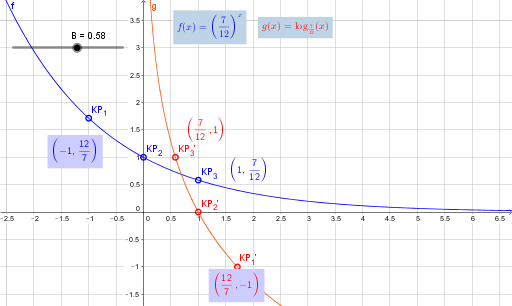
This example demonstrates the characteristics and properties of logarithmic functions with bases between 0 and 1. Key math concepts include the definition of logarithmic functions, graph transformations, monotonicity, and the relationship with exponential functions. Construction highlights involve using FractionText to create fractional labels, Slider to control parameter 'a', and objects like 'f', 'g' for function graphing, 'B' for base representation, KP series for linear programming visualization, and text objects for annotations. Suitable for high school mathematics education to connect visual representations with abstract concepts.
GeoGebra Commands & Parameters
FractionText(a) → text1FractionText(KP_1) → text2FractionText(KP_2) → text3FractionText(KP_3) → text4FractionText(KP_1') → text5FractionText(KP_2') → text6FractionText(KP_3') → text7FractionText(B) → text10
AI Drawing Prompt Reference
Draw logarithmic function graphs to illustrate characteristics and properties of functions with bases between 0 and 1, including monotonicity, graph transformations, and the relationship with exponential functions. Use a slider to control parameter 'a', and fractional labels to annotate key points like KP series and base B. Include text annotations explaining function definitions and properties for visual learning.
The prompt above was compiled from the original drawing commands and is for reference only.