
Local Linearity
Loading the math board and drawing, please wait…
In collections
AP Calculus AB Applet Collection
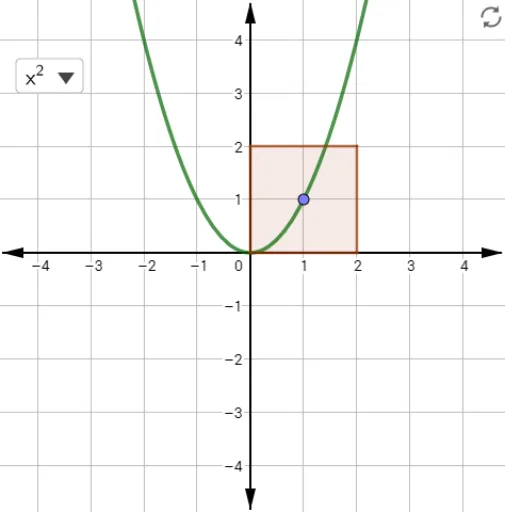
This example demonstrates the concept of local linearity. It uses a sine function to illustrate this concept, involving core mathematical concepts such as functions and trigonometry. The construction summary shows the use of points, line segments, and function objects. Suitable for high school mathematics education and learning.
GeoGebra Commands & Parameters
SelectedElement(flist) → fPoint(f) → APolygon((xa - h, ya - h), (xa - h, ya + h), (xa + h, ya + h), (xa + h, ya - h)) → hsqr, segHsqr1, segHsqr2, segHsqr3, segHsqr4
AI Drawing Prompt Reference
Draw a sine function and demonstrate local linearity by zooming in on a point. First, plot the sine function, then select a point on the function and draw a small square centered at that point to show the linear approximation near that point.
The prompt above was compiled from the original drawing commands and is for reference only.