
Gradient of a Sine Function
Loading the math board and drawing, please wait…
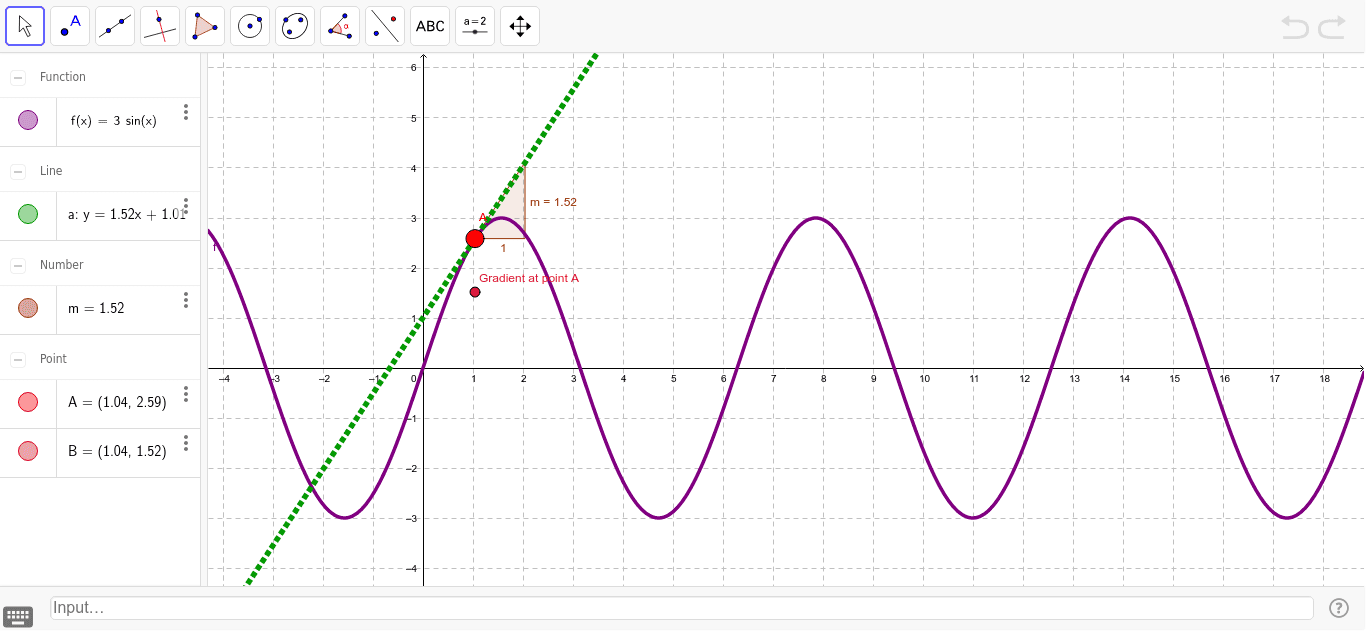
This example demonstrates how to plot a sine function and its tangent at a specific point using GeoGebra, along with calculating the derivative at that point. Core math concepts include sine function, derivative, tangent slope, and differential calculus. Constructed using GeoGebra commands/objects like Point, Tangent, and Slope. Suitable for high school calculus education to visually understand the geometric meaning of derivatives and the physical significance of tangents.
GeoGebra Commands & Parameters
Point(f) → ATangent(A, f) → aSlope(a) → m
AI Drawing Prompt Reference
Plot the sine function y=sin(x), draw the tangent line at x=π/4, and calculate and display the slope of this tangent line.
The prompt above was compiled from the original drawing commands and is for reference only.