
Normal Distribution of Theft Losses by Naveenkumar (2)
Loading the math board and drawing, please wait…
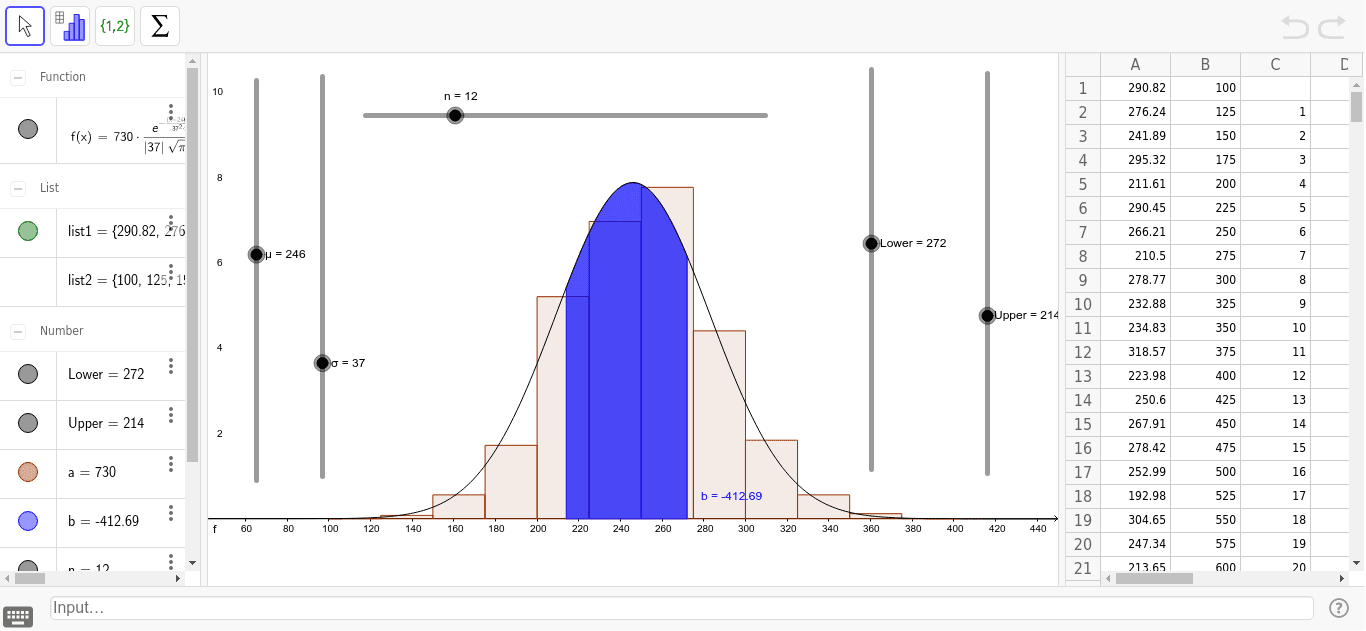
This example demonstrates the normal distribution of theft losses. It involves the core mathematical concept of normal distribution. Using GeoGebra commands such as Histogram and Integral, it constructs a clear histogram and integral areas, helping to understand important concepts in probability and statistics. Suitable for high school mathematics education and learning.
GeoGebra Commands & Parameters
Histogram(list2, list1, true, 1) → aIntegral(f, Lower, Upper) → b
AI Drawing Prompt Reference
Draw a normal distribution histogram for theft losses, including a normal distribution curve and the area under it, showing probabilities in different intervals. First, draw the histogram, then calculate and display the integral area for a specified interval.
The prompt above was compiled from the original drawing commands and is for reference only.