
Live Dotplot Demonstration
Loading the math board and drawing, please wait…
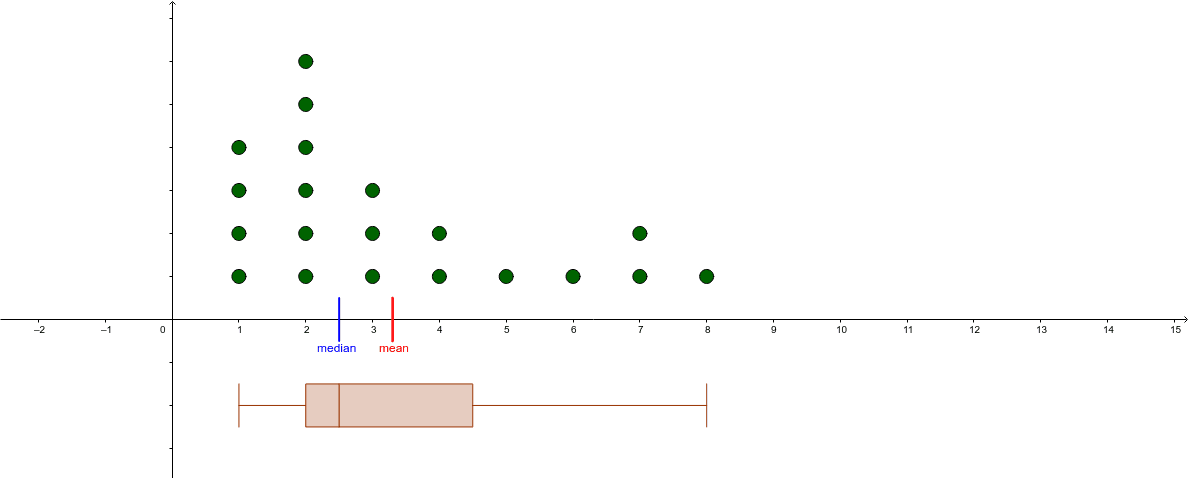
This example demonstrates a dynamic dotplot where moving points alters the dataset, visually representing data distribution. Core math concepts include statistics (means, median), geometric distribution, polynomial functions, real numbers, upper and lower sums (Riemann sums), and congruence. Construction highlights the use of GeoGebra commands like Sequence, BoxPlot, Percentile, and Segment. Suitable for high school students and math enthusiasts studying data statistics and visualization.
GeoGebra Commands & Parameters
Sequence(x(Element[list1, k]), k, 1, Length[list1]) → list2BoxPlot(-2, 0.5, list2, true) → cPercentile(list2, 0.5) → dPercentile(list2, 0.75) → ePercentile(list2, 0.25) → fSegment((Mean[list2], (-0.5)), (Mean[list2], 0.5)) → gSegment((Median[list2], (-0.5)), (Median[list2], 0.5)) → h
AI Drawing Prompt Reference
Create a dynamic dotplot where moving points alter the dataset to visually represent data distribution. Include a box plot showing data distribution, a sequence of points representing the dataset, and vertical line segments indicating the mean and median. Also, add line segments for the 25th, 50th (median), and 75th percentiles, all perpendicular to the x-axis. Start with the point sequence and box plot, then add the mean and median lines, followed by the percentile lines.
The prompt above was compiled from the original drawing commands and is for reference only.