
Data Transformation Exploration
Loading the math board and drawing, please wait…
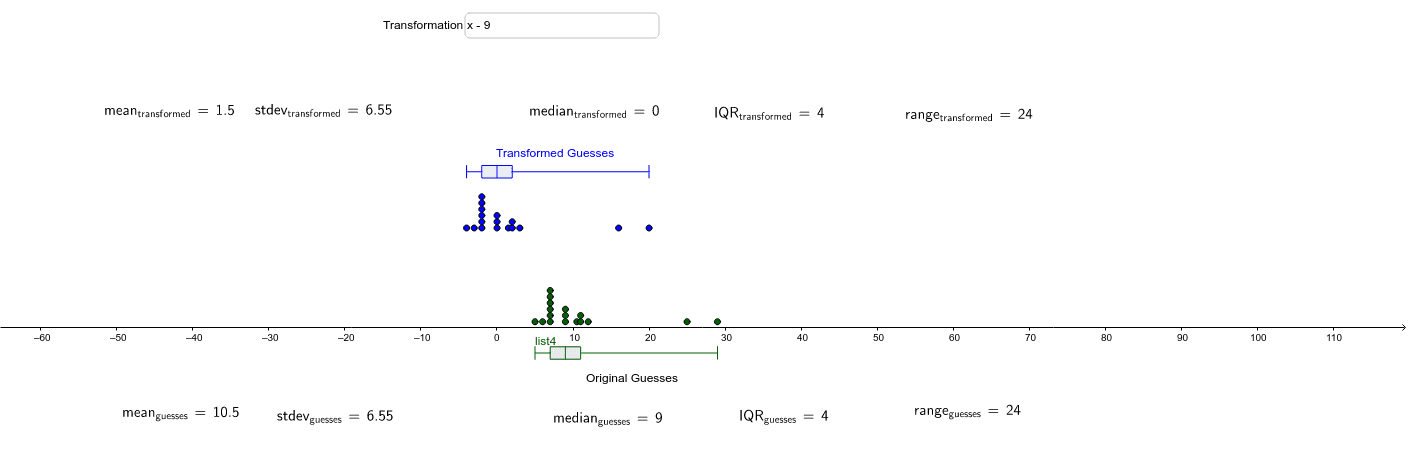
This example demonstrates how the shape, center, and spread of data change when transformed by a constant. It involves core math concepts like data distribution, statistics (mean, median, IQR, standard deviation), and linear transformations. Constructed using GeoGebra commands like DotPlot, BoxPlot, Sequence, Mean, SampleSD, etc., with objects such as lists and text fields to compare original and transformed data. Suitable for high school and above, ideal for probability & statistics and data analysis education.
GeoGebra Commands & Parameters
DotPlot(list2) → list3DotPlot(list1) → list4BoxPlot(-0.5, 0.25, list2) → bSequence((x(Element[list3, k]), y(Element[list3, k]) + 15), k, 1, 17) → list5BoxPlot(-4, 1, list1) → aBoxPlot(25, 1, list2) → cTextfield(f) → inputBox1Mean(list1) → dMean(list1) → mean_guessesMean(list1) → mean_{guesses}LaTeX(mean_{guesses}, true, true) → text2Mean(list2) → mean_{transformed}LaTeX(mean_{transformed}, true, true) → text3SampleSD(list1) → stdev_{guesses}SampleSD(list2) → stdev_{transformed}LaTeX(stdev_{guesses}, true, true) → text4LaTeX(stdev_{transformed}, true, true) → text5LaTeX(IQR_{transformed}, true, true) → text8LaTeX(IQR_{guesses}, true, true) → text6Median(list1) → median_{guesses}Median(list2) → median_{transformed}LaTeX(median_{guesses}, true, true) → text7LaTeX(median_{transformed}, true, true) → text9LaTeX(range_{transformed}, true, true) → text10LaTeX(range_{guesses}, true, true) → text11
AI Drawing Prompt Reference
Create scatter plots and box plots for two sets of data to show how the shape, center, and spread change under linear transformation. The first set is plotted as a scatter plot, while the second set is shifted upwards by 15 units and also plotted as a scatter plot. Include box plots for both data sets, and label the mean, median, IQR, and standard deviation to compare the statistics of the original and transformed data.
The prompt above was compiled from the original drawing commands and is for reference only.