
Linking Factorising to Graphical Roots (1x^2 Only)
Loading the math board and drawing, please wait…
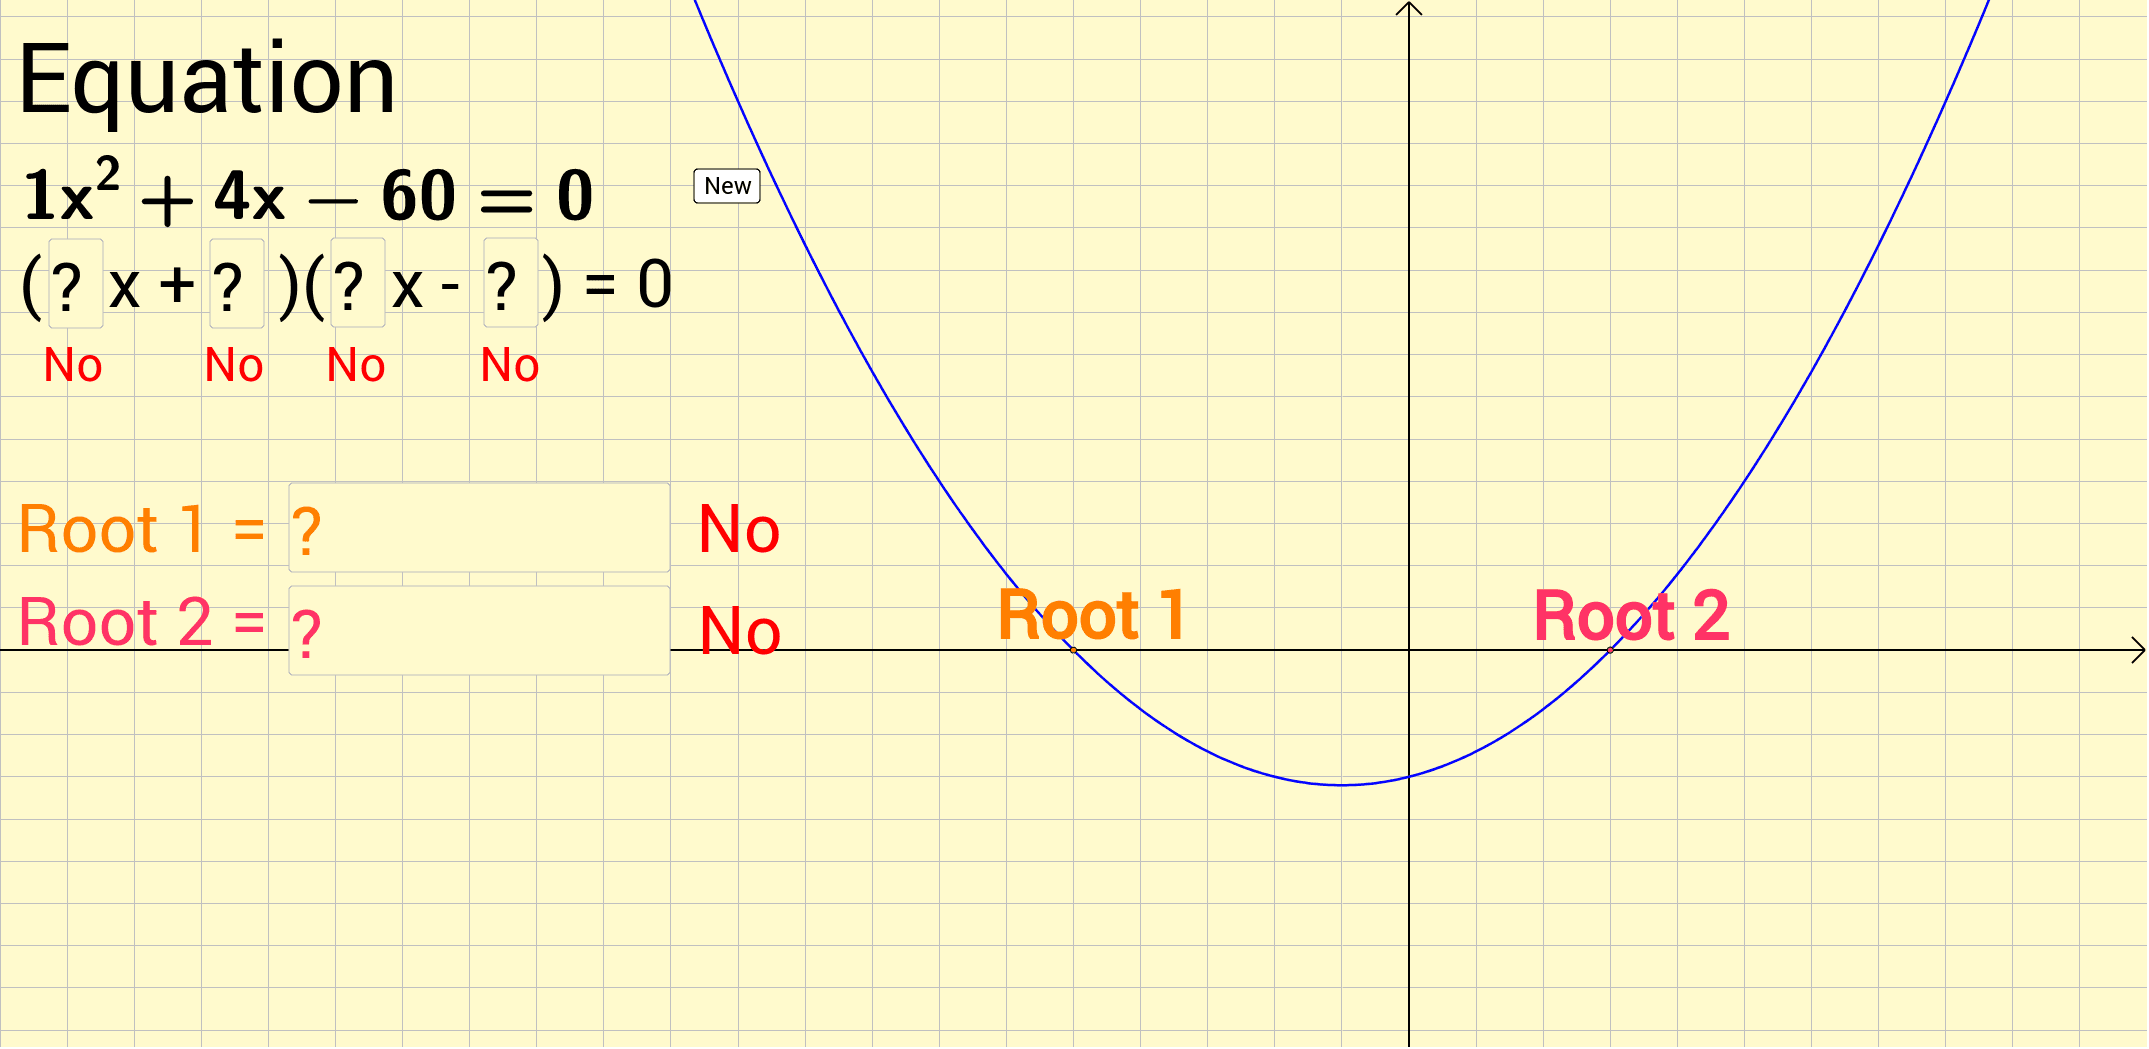
This example demonstrates how to find the roots of a quadratic function by factorizing it and connecting it to the graphical representation on the x-axis. Core math concepts include factorization, quadratic functions, graphical roots, and solving quadratic equations. It uses GeoGebra commands like Random, If, Textfield, Root, and Extremum to construct the demonstration. Suitable for high school students to understand the relationship between factorization and graphical roots of quadratic functions through dynamic visualization.
GeoGebra Commands & Parameters
Random(-10, 10) → bRandom(1, 1) → aRandom(1, 1) → cRandom(-10, 10) → dIf((a * d) + (b * c) < 0, (-((a * d) + (b * c))), (a * d) + (b * c)) → BIf((b * d) < 0, ((b * d) * (-1)), (b * d)) → CIf((a * d) + (b * c) < 0, "-", "+") → sign1If((b * d) < 0, "-", "+") → sign2If(b < 0, "- ", "+") → sign3If(d < 0, "- ", "+") → sign4Textfield(ansA) → InputBox1Textfield(ansB) → InputBox2Textfield(ansC) → InputBox3Textfield(ansD) → InputBox4Root(f) → L, MTextfield(root1) → InputBox5Textfield(root2) → InputBox6Extremum(f) → N