
Linear Vertical Translation
Loading the math board and drawing, please wait…
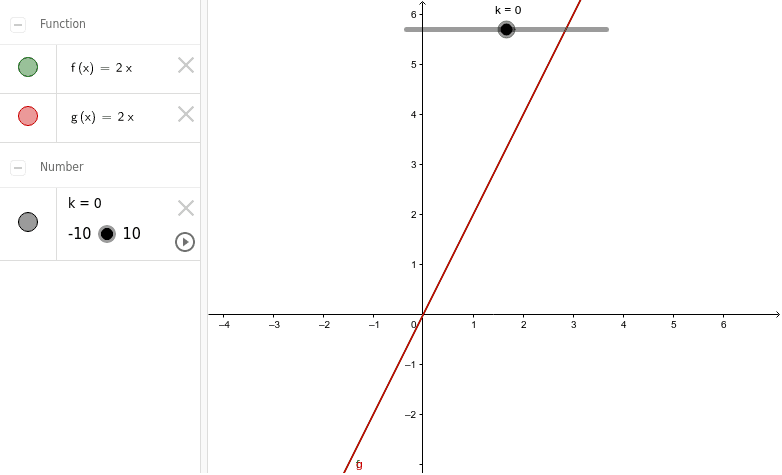
① This GeoGebra example dynamically demonstrates the vertical translation of a linear function graph, showing how changing the constant term shifts the line up or down. ② The core mathematical concept is function graph transformation, specifically the effect of adding a constant k to a linear function f(x) to obtain g(x)=f(x)+k, and how this affects the y-coordinates of all points while preserving the slope. ③ Construction: Based on the summary, the objects include f (original linear function), k (translation amount), and g (translated function). By adjusting k via a slider or input, users can observe the vertical shift of the graph and compare corresponding points between f and g. ④ This is suitable for middle school or early high school students learning function transformations, as well as for teachers demonstrating the concept in class. It helps learners grasp that vertical translation does not alter the shape or slope of the line, only its position along the y-axis.
GeoGebra Commands & Parameters
f(x) = (2 * x)Numeric k(0.0)g(x) = (2 * x) + k
AI Drawing Prompt Reference
Draw a coordinate plane with a straight line passing through the origin, having a slope of 2, so it tilts upward from left to right. Add a second line parallel to the first, shifted vertically by an adjustable amount controlled by a slider or input field. As the value increases, the second line moves up; as it decreases, it moves down. The two lines remain parallel with the same slope. Label both lines with their function expressions to clearly show how adding a constant shifts the graph vertically without changing its shape.
The prompt above was compiled from the original drawing commands and is for reference only.