
Horizontal Translation of Function Graphs
Loading the math board and drawing, please wait…
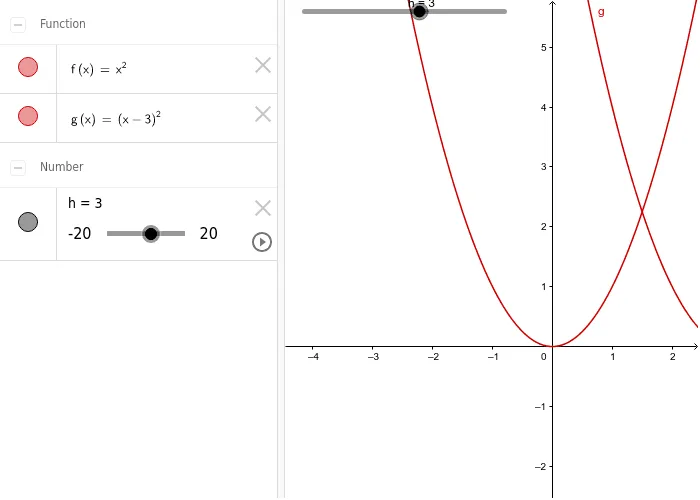
This example demonstrates the horizontal translation of function graphs along the x-axis, visually showing how the graph shifts left or right when the input variable changes. Core mathematical concepts include function transformations, horizontal shifts, the correspondence between algebraic expressions and their graphs, and coordinate-plane geometry. Construction points: the GeoGebra objects f, h, and g are used, where f defines the original function, h serves as the horizontal translation parameter (typically controlled by a slider), and g represents the translated function, commonly constructed as g(x) = f(x − h). Users can dynamically observe how the graph moves as h varies. Suitable for middle school and high school mathematics instruction, classroom demonstrations, inquiry-based learning, and independent practice, helping students develop an intuitive understanding of graph transformations and the connection between algebra and geometry.
GeoGebra Commands & Parameters
f(x) = x^(2)Numeric h(3)g(x) = (x - h)^(2)
AI Drawing Prompt Reference
Draw the quadratic function y=x², then create a horizontal translation parameter h with a value of 3. Based on this parameter, construct a new function g(x)=(x-3)² and observe how the graph moves horizontally as h changes.
The prompt above was compiled from the original drawing commands and is for reference only.