
Linear Programming Illustration (1): Feasible Region and Optimal Solution
Loading the math board and drawing, please wait…
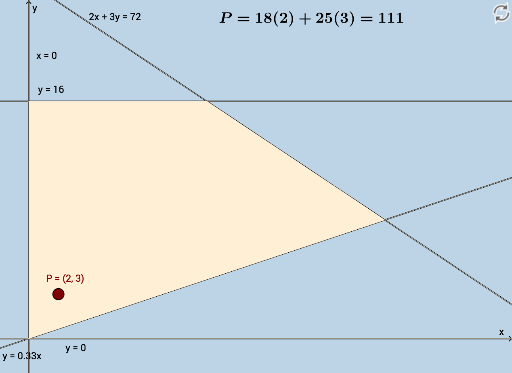
This example demonstrates the graphical method for linear programming problems, visualizing the feasible region defined by linear inequalities and the optimal solution of the objective function. Core concepts include linear inequality systems, feasible regions, and objective functions. Construction utilizes GeoGebra commands like PointIn and Line to build geometric objects and boundaries. Suitable for high school or college mathematics courses for teaching demonstrations or self-study, helping students understand the geometric meaning of optimization problems.
GeoGebra Commands & Parameters
PointIn(f) → PLine((12, 16), (24, 8)) → t